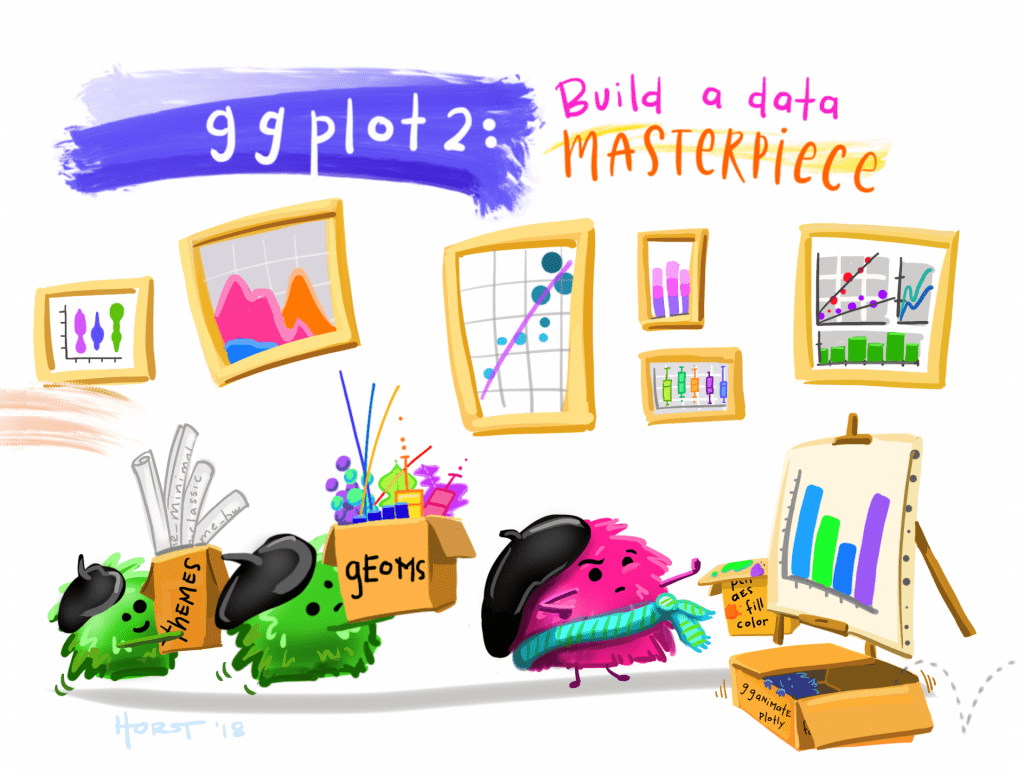
R can be used to create data visualizations that are high quality and fully customizable. Here at Lehigh, LTS offers a seminar on data visualization with R each semester. It’s a perfect, instructor led, workshop that focuses on some background, as well as a modern approach to programming and visualizing data. In this workshop, we cover building a range of visualizations, from basic, static plots, to 3-D, interactive models. Basic programming experience is preferred.
Data Visualization with R – LTS Seminar (updated fall 2021):