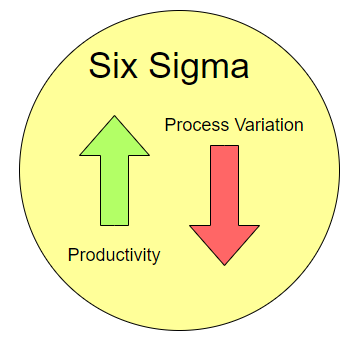
Six Sigma is a method that provides tools to improve the capabilities of business processes. This helps increase productivity and reduce variation in process leading to eliminating defects, improving the quality of service and products, employee productivity & morale, and finances & profits of the organization.
 The main objective of six sigma methodology is to standardize processes so that the probability of errors is reduced. This is done using statistical quality process methods. A six sigma process is one in which 99.99966% of opportunities of a part of process is to be statistically free of defects.
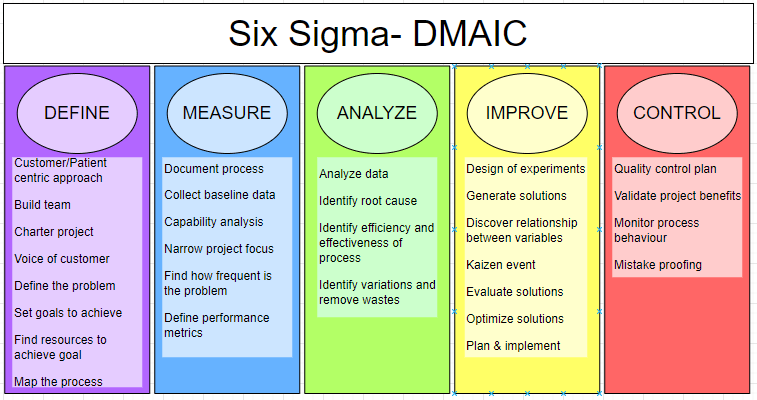
The Six Sigma Methodology -DMAIC & DMADV
Six Sigma methodology mainly consists of two main concepts
- DMAIC– Define, Measure, Analyze, Improve, and Control
- DMADV– Define, Measure, Analyze, Design, and Verify
DMAIC is a data driven quality strategy that is useful when trying to improve an existing process, service or product. The DMAIC concept is a series of five steps that is used to
- understand or define what the problem is,
- then it is measured to receive existing data at unaltered state,
- once it has been measured the problem and data is analyzed to understand the root cause,
- after analyzing improvement strategies are developed to address the root cause,
- and lastly is to control the improvements and look for future improvements.
DMADV also known as Design For Six Sigma (DFSS) is a process methodology that is employed to design or re-design a process that does not exist. The DMADV also consists of five steps,
- first define what are the requirements of the project from the perspective of the patient/customer,
- then understand what are the relevant metrics to track and measure the requirements,
- analyze how can the goals be best achieved,
- after analyzing the data is used to design the new service or product,
- and finally in the verify phase it is checked if the end results meets or exceeds the customer requirements

Application of Six Sigma Methodology in Healthcare
Healthcare is mainly a service oriented industry which can be a hands-on process. This leads to high possibility of variations as compared to other industries. Six Sigma principles can be used to eliminate defects, variation in process leading to a more streamlined process, improving quality and less costly.
- Defect– defects in healthcare is defined as a factor that leads to patient dissatisfaction
- Define– what do the patient’s want? what are the customer expectations whether- patients, staff or payers? what is the objective of the identified problems or issues?
- Measure– converting the critical quality factors (CTQs), voice of the customer into measurable variables. These metrics can be divided into four groups: service level, service cost, customer satisfaction and clinical excellence.
- Analyze– the team identifies what are the causal factors (X’s) which are most likely to have an impact on the response variable (Y’s). If the causal factors are controllable and significantly influences the response variable then the results can be improved by controlling the causal factors (X’s). If the causal factors are uncontrollable then a new process should be created to reduce the variability. An example of a uncontrollable factor in healthcare is arrival rate of patients to the Emergency Department (ED).
- Improve– implement modifications to improve the process
- Control– monitor performance to maintain improvement by introducing new control measures and process metrics to drive behaviour and cultural changes in the organization
 Some ways how Six Sigma has helped healthcare. Six Sigma has known to improve patient care by
- Reducing the number of variations by physicians, nurses, technicians by standardizing processes
- Improving lab turnaround times
- Improve patient appointment waiting times
- Improving patient outcomes
- Decreasing the number of steps in the supply chain
- Accelerating reimbursement for insurance claims

Six Sigma Tools & Techniques
Various tools and techniques are used in six sigma projects
| SIX SIGMA TECHNIQUES | DESCRIPTION |
| Brainstorming | Is done by assessing the given situation and gathered information, discussing about creative ideas and solutions. The main aim is to come up with multiple creative ideas and then narrow it down to feasible solutions. |
| Root Cause Analysis/5 Why | This technique is done to reach to the root of the problem by questioning why the problem occurred 5 times. Solutions are constructed to address the root cause of the problem. |
| Voice of Customer | Is the customer/ patient’s perspective, comments, requirements, expectations of the product or service under discussion. This is used to define our problem and identify the metrics to measure. |
| The 5S system | Is used to create an organized environment improving efficiency of work. It consists of 5 steps- sort, set, shine, standardize and sustain. |
| Benchmarking | It is a process that is used to compare the performance of the output (process, service, product) to a standard. This is done by interviewing, conducting site visits and documenting the performance and comparing the results to the set standard to understand the gaps. |
| Kaizen | Is continuous improvement of processes, service or products by creating a standardized method, increasing efficiency and reducing waste. |
| Poke-yoke/ Mistake Proofing | It is a method of taking steps to mistake proof a process. It starts with understanding the cause effect relationship of the defect followed by a remedy that prevents the defect from occurring. |
| Value Stream Mapping | Is used to understand the information and material flow in a process. It is useful to identify potential areas of improvement leading to increased efficiency. |
| SIX SIGMA TOOLS | DESCRIPTION |
| Cause and Effect Analysis | Also known as fishbone /Ishikawa is used to show the potential causes of a particular event or issue. It also helps to understand root cause of the problem. |
| Flow Chart | It lays out the various stages or steps within the process. It is helpful tool in standardizing a process. |
| Pareto Chart | It is a graphing method that provides information on the frequency of defects and their cumulative impact. |
| Histogram | Is an approximate representation of distribution of numerical data. It divides the range of values into intervals and group the values according to the intervals . |
| Check Sheet | It is documentation of quantitative or qualitative data in real time at the location where the data is generated. |
| Scatter Plot | Is a mathematical diagram that is used to display typically two variables for a set of data. It can be used either when one continuous variable is under the control of the experiment and the other depends on it or when both continuous variables are independent. |
| Control Chart | It is a graph that is used to study how a process changes over time. These charts usually have a central line that represents the average, upper limit line and lower limit line. Historical data is used to plot these charts and the charts are used to understand the various patterns in existing data. |
A mix of these tools and techniques aid in understanding the existing process, identify areas that can be improved, develop solutions and implement improvement strategies driving organizations to achieve six sigma quality.