In this post, we explore the data collected from six weeks of field work on Broad Street, accounting for over 15 hours of on-site study and recording the behavior of nearly 3,000 total pedestrians.
Key Discoveries
- Roughly half (47%) of all pedestrians use Broad Street as a pass-through corridor, entering the observation zone on their way to somewhere else. Nevertheless, this means that just over half of the pedestrians we observed engaged in some sort of activity in the Broad & New neighborhood. A significant number of these individuals visited this area for dining out (26%), work-related tasks (7%), shopping (6%), and other leisure activities (6%). At certain times, such as night (8:00 – 11:00 p.m.), dining out (43%) actually overtakes passing through (34%) as the primary pedestrian activity in the area.
- Broad Street is an overwhelmingly adult space, with adults accounting for 91% of all area pedestrians. Youth (5.1%) comes in a distant second, followed by seniors (2.7%), and finally infants (1%). At the same time, men (59%) visit Broad Street with more frequency than women (41%). There was no significant change to the age or gender mix of the street before or after parklet installation.
- Nearly half of all pedestrians enter the observation zone alone (49%). An additional 31% of pedestrians visit in groups of two while another 10% come in groups of three. Groups larger than three account for the remaining 10%.
- During the observation period (June 4 – July 20), we saw a steady rise in average foot traffic per 15-minute observation period. When comparing these numbers before and after parklet installation we consistently saw a dramatic increase, sometimes as high as 100%. While a day-by-day scatterplot suggests that some of this increase is due to seasonal pedestrian increases, there is nevertheless an increase in the number of people who stop in the area once the parklet was installed. Prior to parklet installation, we almost always saw less than 1/3 of pedestrians stop in the area; after parklet installation, the pattern flipped and we almost always saw more than 1/3 of pedestrians stop in the area.
- Both the average pedestrian traffic and the average number of stationary activities depended greatly on the time of day. During the mornings (8:00 – 11:00 a.m.) very few pedestrians traveled down Broad Street regardless of whether the parklet was installed or not. By contrast, during the evenings (5:00 – 8:00 p.m.), pedestrian traffic not only increased but also appeared more dependent on whether or not the parklet was installed.
Methodology
We conduct regular on-site observations at the Broad St. Parklet. In fifteen-minute intervals, the observer recorded the Group Size, Age, Gender, Activity, Time Spent on Street, and Method of Transportation for each person who entered the 1/2 block observation zone. We also record the Date, Day of Week, Weather, and Time as well as any Special Events that would significantly alter area traffic and individual behavior (such as a summer festival or a parklet-hosted event). Time of day was then coded into five grouping: Morning (8am-11am), Mid-day (11am-2pm), Afternoon (2pm-5pm), Evening (5pm-8pm), and Night (8pm-11pm). These secondary observations allow us to discover trends across a wider range of variables. The full list of recorded observational data is as follows:
| Activity | Activity recorded the various activities individuals performed within the observation zone. These activities include public acts such as Passing Through, Parking, and Walking Dog as well as economic acts such as visiting one of the many businesses located in the observation zone. This variable allows us to study how individuals who enter this section of Broad Street use its businesses and amenities. |
| Time Spent on Street | Time Spent on Street recorded the length of time (in minutes) everyone spent within the observation zone. For those simply passing through the area (not stopping at any business using any public amenity), the time was recorded as zero. Otherwise, the time spent on the street was recorded up to the maximum of 15 minutes, or the full length of time we spent observing the street. |
| Transportation | Transportation recorded how an individual entered the observation zone and is recorded as one of three values: as a pedestrian, on a bicycle, or by car. Individuals who parked outside of the observation zone but entered it on foot were recorded as pedestrians. Individuals who drove through the observation zone but did not park or get out of their vehicle were not recorded. |
| Group Size | Group Size recorded the number of individuals in a given party, ranging from one to six. |
| Age | Age recorded the observed age of individuals in the observation zone as one of four values: infant, youth, adult, and senior. |
| Gender | Gender recorded the observed gender of individuals in the observation zone as one of two values: male and female. |
| Special Event | Special Event allowed us to track local community events that might alter pedestrian behavior in the area. Recorded values (to date) included pre-installation, none (indicating post-installation, but no other activity occurring), Board Games, Tap Takeover, and Painting in the Parklet. |
Observation Zone
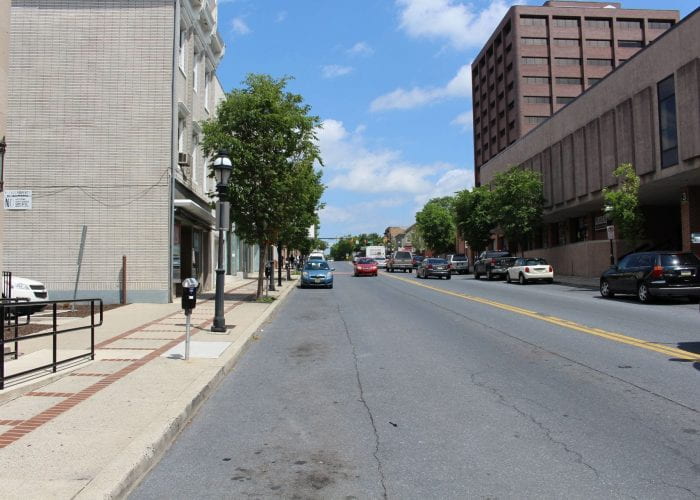
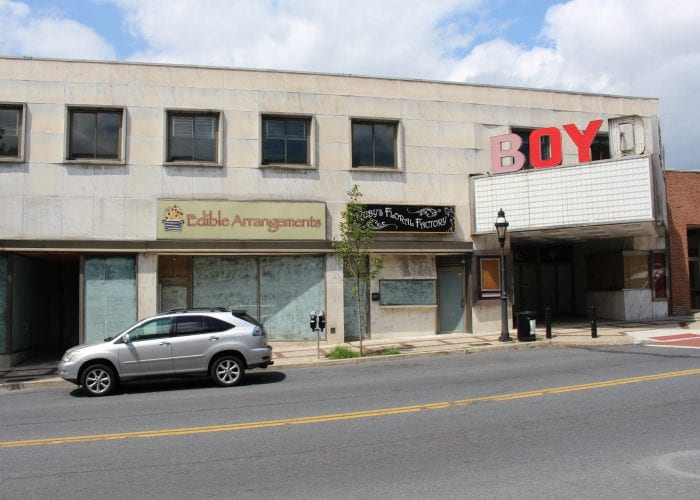
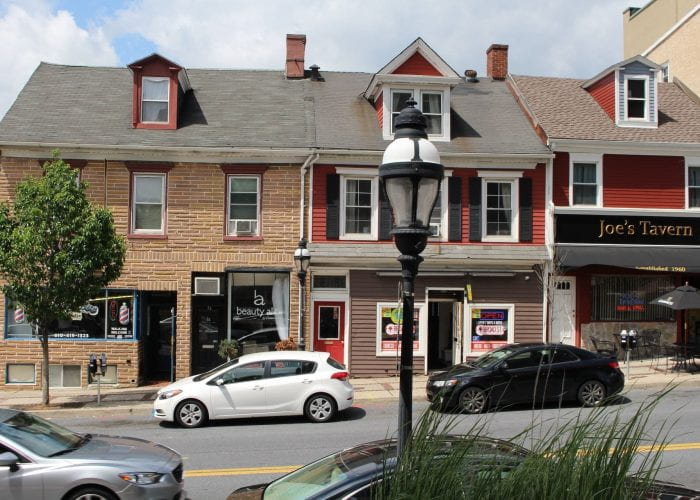
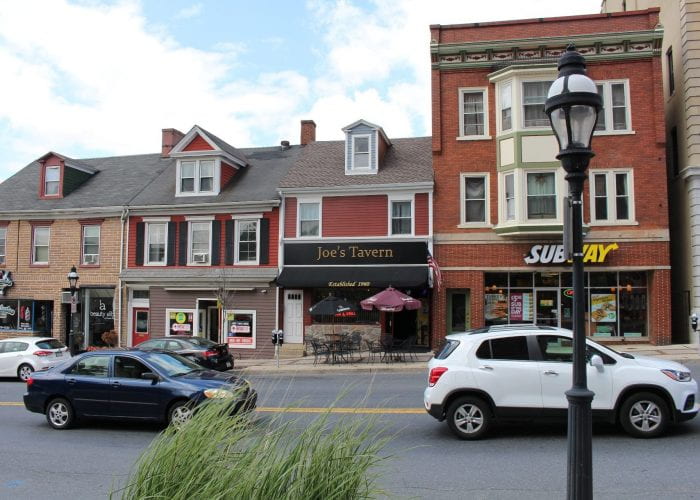
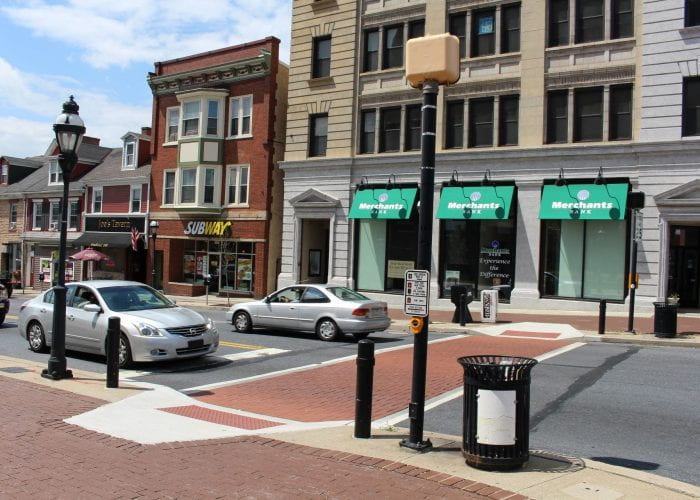
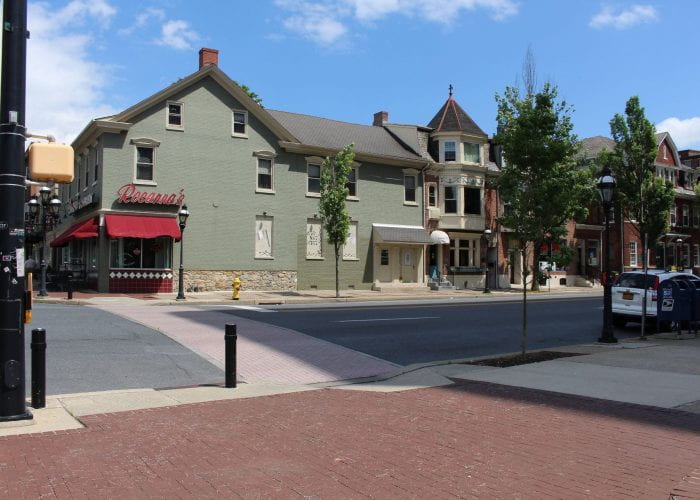
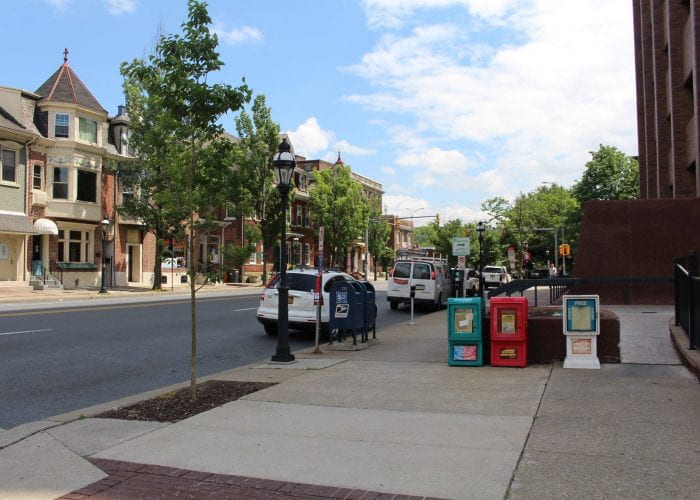
The observation zone extends roughly one-quarter block in both directions from the Broad St. Parklet (extending across the New Street intersection to the East and halfway to the Guetter Street intersection to the West).
The image slideshow below provides a visual tour of the Broad Street observation zone and the surrounding neighborhood:
Observation Zone Amenities
The observation zone includes a variety of businesses and city amenities including, such as:
- One LANTA bus stop (eastbound routes: 101, 102, 327, 215, 605, 217)
- 12 parking spots (11 after parklet installation)
- 11-story business plaza with patio, green space, and fountain out front
- Brick Pizza
- Rosanna’s Restaurant
- Pennsylvania Senator (Lisa Boscola) Bethlehem office
- The Melting Pot Restaurant
- Merchants Bank
- Subway
- Joe’s Tavern with small sidewalk patio out front
- PowerSchool
- Broad St. Mini Mart
- Beauty Alibi Salon
- Exclusive Cutz Barbershop
Baseline Data
Baseline data was collected by observing the Broad Street observation zone for two weeks prior to parklet installation in 15-minute intervals. Over the course of this period, we observed nearly 1,000 individuals in the observation zone, offering us a strong sample to compare to our post-installation data.
Results
The embedded document below offers an interactive overview of parklet observation data. By navigating through the story panes at the top of the visualization and using the highlighter tools on the right-hand side of the document, you can explore who is visiting this section of Broad Street, why they are in the area, and how the parklet impacts that behavior.
We learned a number of things from this collection of data. First, we got a clear and qualitative sense of how people engage with this section of Broad Street. As the first graph reveals, 47% of pedestrians used Broad Street as a corridor to walk on their way to somewhere else. However, a significant number of pedestrians also use the space for dining out (26%), work-related tasks (7%), shopping (6%), and leisure activities (6%). Moreover, despite some notable concern among online commenters regarding parklets being an improper use of high-demand parking spaces, only 5% of people in the observation zone actually used one of the area’s twelve parking spaces during their visit.
The scatterplots in the data series above suggest that even though Broad Street pedestrian traffic certainly experiences seasonal fluctuations (increasingly steadily as summer approaches and begins), the parklet also brings pedestrians to the area and keeps them there longer.
