In this post, we explore the data collected from 70+ parklet user perception surveys collected during July of 2018. Our questions ask participants to consider the economic impact of parklets and the effect they have on the surrounding community atmosphere.
Key Discoveries
Social & Economic Impact
- Survey participants are overwhelmingly optimistic about the parklet and its impact on the community. Average perception ratings range from a low of 4.01 (indicating average agreement with the statement that “this parklet increases the sense of safety in the neighborhood”) to a high of 4.48 (indicating strong agreement with the statement that “this parklet improves the neighborhood”).
- Of those who indicated they spent money before or after visiting the parklet, the average amount spent was $59. While the majority of participants spent this money at Joe’s Tavern (where the parklet is located), respondents also reported spending money at another dozen businesses, including neighboring businesses (such as Subway and Rosanna’s), businesses further down Broad Street (such as Ripper’s and MetroPCS), and businesses located on Main Street (such as Urbano and McCarthy’s).
- When asked, “how did you use the parklet,” 53% of survey participants said that they were primarily there as Joe’s Tavern patrons. Others used the parklet to sit and rest (18%), talk or meet up with friends (16%), and eat food from a nearby restaurant (10%) or food brought from home (3%).
- Survey participants self-reported an average of one hour spent in the parklet, although the range is quite broad, spanning from just five minutes to over three hours.
Parklet Design & Safety
- Survey participants are overwhelmingly pleased with the parklet’s design (59% rated the overall design as “excellent” while another 28% said it was “good”). Several participants also commented on an improvement in design and quality compared to the 2017 parklets.
- Average design ratings range from a low of 4.06, indicating a “good” average rating for parklet comfort, to a high of 4.67, indicating a “good-to-excellent” average rating for parklet location.
- Contrary to the safety concerns expressed in the social media responses to news of the parklet, 78% of survey participants rated the parklet’s safety as either “good” (33%) or “excellent” (44%). Only 8% of survey participants rated the parklet’s safety as either “poor” (4%) or “very poor” (4%). An additional 70% of survey participants either “agreed” (21%) or “strongly agreed” (49%) with the statement “this parklet makes the neighborhood feel safer.
Demographics
- Survey participants were diverse in age (37% Millennials, 23% Gen X, and 16% Boomers). Most of those who participated (64%) are members of the local Broad & New community (defined as living within 5 miles of the parklet).
- Survey participants predominantly identified as white (82%). An additional 14% identified as Hispanic, Latino, or Spanish. By contrast, the U.S. Census report for Bethlehem City found Bethlehem City to be 61.0% white (alone) and 27.9% Hispanic or Latino.
- 78% of survey participants are Bethlehem residents. The remaining 22% are spread fairly evenly between Allentown (8%), Fountain Hill (4%), Bath (2%), Easton (2%), Coopersburg (2%), Lehigh Township (2%), and Fogelsville (2%).
- The top three reasons people visit Broad Street are (a) because they live nearby (36 people), (b) for pleasure (27 people), and (c) to meet friends (20 people). 13 people also indicated that they work nearby and another 10 people mentioned they were dining in the area.
Methodology
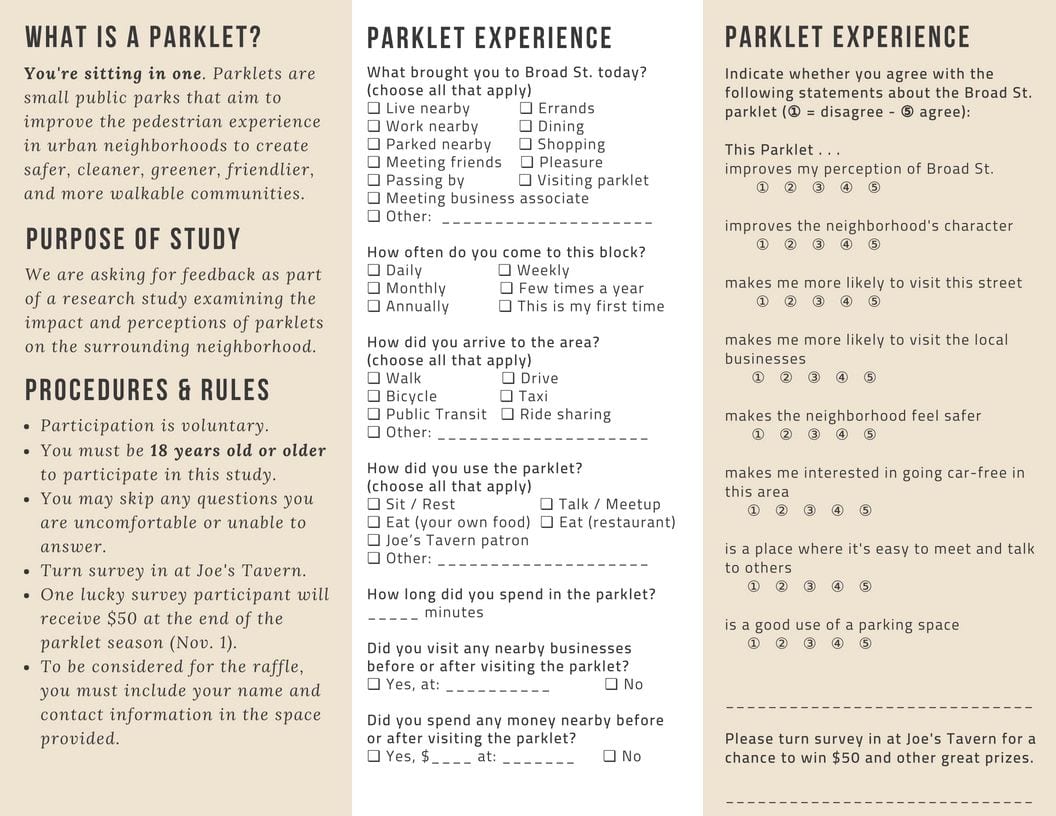
The user perception survey consists of 24 questions divided into three sections: experience, design, and demographics. Together, these questions are designed to capture participants’ perceptions of (1) the Broad Street & New neighborhood, (2) reasons for visiting the area, and (3) the impact parklets can have in a community like downtown Bethlehem.
| Parklet experience | Parklet experience questions ask participants to describe what brought them to the specific section of Broad St. under observation. This section also asks participants to explain their perceptions of Broad St. and consider how the parklet influences those perceptions. |
| Parklet design | Parklet design questions give participants the opportunity to rank specific aspects of the parklet construction and placement. After the numeric rating, participants can also explain their scores through a series of short answer questions. This section also asks participants to imagine additional events, amenities, and design elements that they would like to see in this or future parklets. |
| Demographics | Demographics allow participants to self-record their age, gender, race, ethnicity, household income, and level of education. For our project, the demographics section also gathers information about where respondents live in relation to the Broad Street parklet. |
The survey questions were formatted into a trifold brochure and left on-site in the Broad Street parklet. This placement allows parklet users to fill out a survey while they are actively visiting the location. For those who prefer to take surveys online, the same questions were loaded into a Google Form and then prominently displayed on our website. Signage in the parklet informed visitors of this digital version and how to find it.
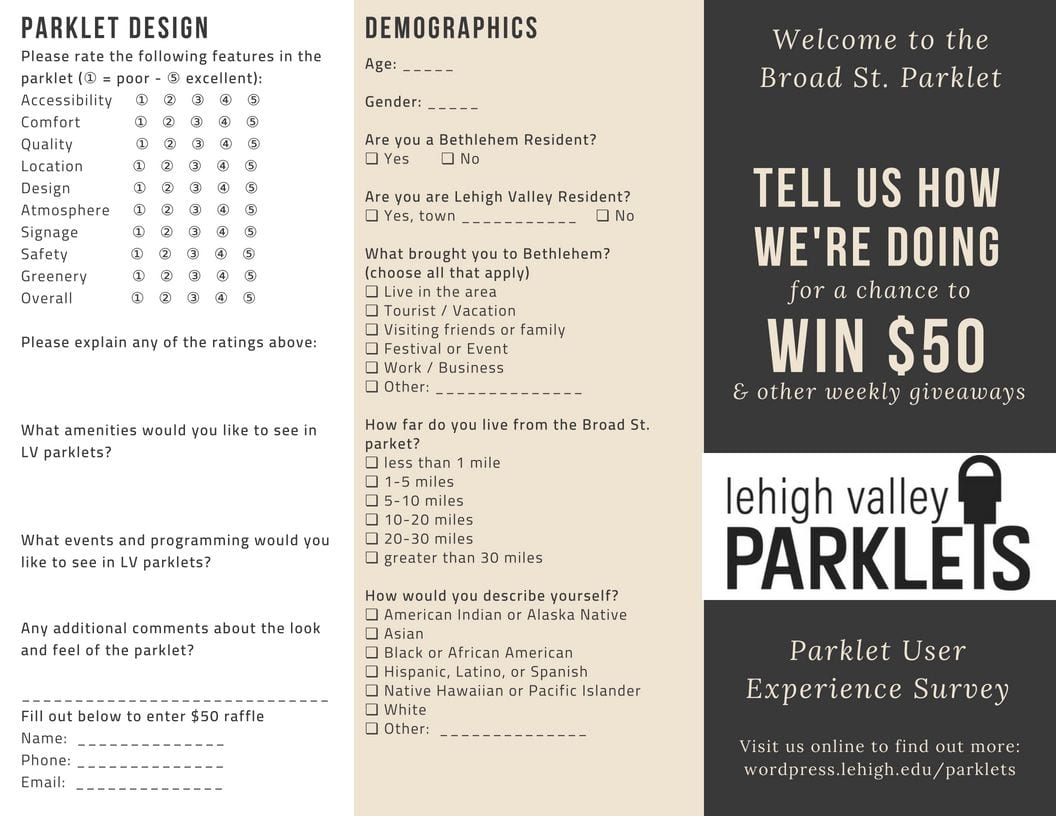
In compliance with IRB standards, survey participation is voluntary and all respondents be at least 18 years of age. The purpose of the study as well as our procedures and rules are explained on the front page of the trifold and available online. In addition to these IRB requirements, all participants must have visited the Broad Street parklet at least once during the 2018 summer installation period (June 22 – November 1); however, this initial post only covers the data collected between June 22 and July 22.
The introduction to the survey reminds participants that all data collected is aggregated and anonymous. If participants are still uncomfortable answering any particular question or questions, they are allowed to skip that question and move on to the next one. To encourage participation, we collaborated with our business partner, Joe’s Tavern, to incentivize filling out the survey. As seen on the tri-fold, filling out the survey allowed participants to enroll in a $50 grand-prize raffle at the end of the parklet season and offered participants a chance to win various weekly prizes provided by Joe’s. As participants completed surveys on-site, the surveys were collected by Joe’s staff and held until the parklet team picked them up for transcription and study. Online surveys were automatically recorded into a Google Sheets documents and later imported into Tableau for analysis and visualization.
Results
The embedded document below offers an interactive overview of parklet user perceptions. By using the menus on the right-hand side of the document, you can view the average perceptions and overall design rating through a variety of filters (age, how close a respondent lived to the parklet, and frequency of a respondent’s visits to Broad Street). These options allow curious viewers to analyze particular cross-sections of data in more detail. For instance, how does the “use of space” perception differ between those who live within 5 miles of the parklet vs. those who travel a greater distance to use it? Alternatively, how do the perceptions of high-frequency Broad Street visitors differ from those who visit the area less often? As you toggle these various filters on and off, all of the information on the visualization updates to reflect the new user population. This includes the information at the top of the document (number of records, the average time spent in the parklet, and the average money spent).
It is possible to make a number of observations by sifting through this data. The demographic information at the top of the visualization gives the viewer a sense of who participated in the survey and also a sense of who is using the parklet and for what reasons. As you can see, while the age range is fairly spread out, distance is much more local. Individuals visit Broad Street for a variety of reasons but, again, many respondents are there due to living or working nearby. These numbers suggest that a parklet’s geographic neighbors are also its primary user base.
The high average perception rankings in all subcategories indicates an overall sense of enthusiasm regarding the Broad Street Parklet project and its community impact. In general, parklet users agree with each of our major claims regarding parklet impact in terms of improving the neighborhood, boosting economic activity, and offering more public space. Combined with the average money spent while visiting the parklet data point, these responses should prove encouraging to other local businesses who might be interested in using a parklet elsewhere in the Lehigh Valley.
Similarly, the high percentage of “excellent” and “good” ratings for the overall parklet design suggests that most of the people who visit the parklet are satisfied with its design. As with average perception ratings, design rating range between 4.06 (comfort) and 4.67 (location). Nevertheless, despite some comments for cushions, charging stations, and misters (to reduce heat), this data shows that a functional parklet can be constructed for as little as $500 in material costs.