Introduction.
This is the first in a series of posts on sleep, a behavior we spend approximately ⅓ of our lives doing. Since we all sleep, we can all relate to its importance. Future posts will examine the neuroanatomy of sleep, as well as other issues related to sleep. However, this post will describe electroencephalography (EEG), the “breakthrough” that made the scientific study of human sleep possible.
In order to scientifically study anything, you must be able to quantify it (i.e. attach numbers to it). Until modern sleep research methods were developed, the only reliable measure was how long people slept, which wasn’t very informative for what’s going on inside the brain. Rapid eye movements and changes in muscle tone were observed, but they seemed to occur sporadically, and could not, by themselves, provide meaningful sleep measures.
However, the use of EEG, a safe and noninvasive procedure, changed everything! Not only did EEG measure sleep depth, it also put the seemingly “random” eye movements and muscle-tone changes into meaningful perspective. However, EEG’s most startling revelation was that sleep is not a single phenomenon but consists of 2 very different types of sleep!
One type of sleep is called REM sleep because of the rapid eye movements that occur. REM sleep is also called paradoxical sleep. The “paradox” is that while the body appears to be entering a deeper stage of sleep as measured by a total loss of muscle tone, the brain appears to be waking up as measured by brain waves. REM sleep is sometimes also called D-sleep because of the desynchronized brain waves that occur (more about that later). The “D” in D-Sleep could also stand for dreaming, since this is the stage that, until recently, was thought to be the sole source of dreaming.
The other type of sleep is called non-REM (NREM) sleep. Eye movements do occur in NREM sleep, but they are less common and much slower. Although the most intense dreaming occurs in REM sleep, dreaming is seen in NREM sleep. There is also passive mental activity during NREM sleep that is different from what most would consider dreaming. NREM sleep is also referred to as S-sleep because the EEG brain waves are more synchronized (more about that later).
NREM sleep and REM sleep alternate in approximately 90-minute cycles. A cycle consists of one period of NREM sleep followed by one period of REM sleep and we normally experience around 3 to 5 of these cycles each night.
In addition to EEG’s use in studying sleep and cognition, it is also useful in diagnosing epilepsy, brain tumors, brain injuries, stroke, and sleep disorders. However, while EEG is excellent for examining quick changes in cortical functioning, it is less useful for determining the neural location of a pathology. For example, tumor and stroke locations are better localized with higher spatial-resolution scans, such as computed tomography (CT) or Magnetic Resonance Imaging (MRI). However, EEG’s advantage is its extremely high temporal resolution (measured in milliseconds), permitting real-time measurement of quick changes in cortical functioning. EEG is also less costly and less complicated than other brain scanning techniques. However, it is now possible to combine EEG scans with higher spatial-resolution scans to obtain the advantages of each.
This post will provide background for future posts by explaining how EEG brainwaves are used to measure sleep. Later posts will go into the neuroanatomy, evolution, and functions of sleep.
Brainwaves are measured with electrodes.
Many universities, medical schools, and hospitals have sleep laboratories for clinical diagnosis and/or basic research. The laboratory typically contains one or more sleeping rooms that look like nicely appointed hotel rooms. The idea is to make the rooms as comfortable as possible to encourage users to go to sleep. While the user is sleeping, the user’s brainwaves are measured by EEG.

In addition to EEG, other physiological variables are also measured during sleep (referred to as polysomnography). These measurements require attaching large electrodes called macroelectrodes all over the body. As you might imagine, it is often difficult to fall and stay asleep the first night. But after several nights, the individual usually begins to sleep normally.
EEG is measured by macroelectrodes on the scalp. These electrodes are attached using a conductive paste secured by tape (as see in Figure 1) or embedded in a cap or net firmly secured on the head. The secondary measures, also measured with macroelectrodes, include eye movements (EOG: electrooculography), heart function (ECG: electrocardiography), muscle tone (EMG: electromyography), and breathing rate. A camera also typically records the subject’s body movements. All of these measures can then be compared to determine their relationship to EEG, and to each other, during sleep.
EEG is measured by a series of macroelectrodes placed in a standardized pattern on the scalp. The number of macroelectrodes can vary depending upon purpose, from as few as 4, up to 256. The higher numbers are most often used for medical diagnosis. However, for sleep research, where spatial resolution is not as critical, the number is usually on the low end of this range. Each EEG macroelectrode detects the combined electrical activity of thousands of neurons in the cerebral cortex. Two measurable properties of brain waves are: 1) amplitude – height of the brain wave and 2) frequency – how often the brain wave occurs, measured in cycles per second (cps). The different stages of sleep are defined by these measurements.
A Taxonomy For Describing Brain Waves
Although EEG was first used by Hans Berger on humans in 1924, sleep researchers did not use it routinely until around the 1960’s. Prior to that time, EEG was used mainly to diagnose epilepsy and other neurological disorders. While the original taxonomy for describing brain waves is still used for this purpose, sleep scientists have modified this taxonomy for measuring sleep.

The original taxonomy used Greek letters to designate the different EEG brain waves (right side of Figure 2). Although not seen in Figure 2, the highest frequency, lowest amplitude brain waves are called gamma waves (30-100 cps). These relatively rare brain waves are the most recently discovered and least understood. They are often associated with intense mental activity such as when an awake person has sudden insight into a previously intractable problem. Prior to gamma wave discovery, beta waves (13-30 cps) were thought to be the highest frequency, lowest amplitude waves. Beta waves are most often seen when the person is awake and actively problem solving, but at a less intense level. Alpha waves (8-12 cps) possess lower frequency, higher amplitude waves and are seen during periods of “relaxed wakefulness.” The person might be daydreaming or engaging in light meditation. Alpha waves would also be seen in some college students as they passively listen to my 8 AM lectures and take notes without actively processing the information (hopefully they will actively process the information before the exam! 😄). Alpha waves are also the predominate brain wave just after a person falls asleep. Theta waves (5-7 cps) continue the trend with even lower frequency, higher amplitude waves. In an awake person, theta waves would be associated with deep meditation but during sleep are the principle brain wave as the person begins entering deeper stages of sleep. Delta waves (1-4 cps) are the lowest frequency, highest amplitude brain wave and occur when a person is deeply asleep.
An important point is that cortical brain wave patterns change gradually as you pass through the different stages of wakefulness and sleep. Another point is that while EEG is the single best measure we have of sleep depth, it is not absolute. It is possible to see gamma, beta, alpha and theta waves both when the person is awake and when asleep. More important than individual brain waves to sleep researchers is their pattern. This pattern, in combination with polysomnography, and in the hands of a trained sleep expert, provides a highly reliable tool for measuring the depth of sleep.
Two Taxonomies For Describing Sleep.
In order to study sleep, sleep researchers developed a different taxonomy defined by the pattern of brain waves (left side of figure 2). In the original 1968 taxonomy, Rechtschaffen and Kales defined a single stage of REM sleep and four different non-REM (NREM) stages. Sleep researchers were not interested in awake individuals, so patterns occurring while awake, usually involving some combination of gamma, beta, and alpha waves, were collectively put into a “wastebasket” category called Stage W (W stands for wakefulness, not wastebasket 😀).
However, research has not found the distinction between the two deepest stages of NREM sleep (NREM3 and NREM4) very useful. As a result, in 2007, the American Academy of Sleep Medicine, collapsed these 2 stages into a new NREM3 stage, also referred to as Slow Wave Sleep. This change can be somewhat confusing since some newer papers published in other countries, continue to use the older taxonomy. This post will use the newer taxonomy.
Although it was originally thought that dreams were unique to REM sleep, we now know that dreams can occur in NREM sleep. However these dreams are not as common as those occurring in REM sleep. NREM dreams also tend to be less vivid and intense than REM dreams, have more disconnected “storylines,” and are generally less memorable.
NREM1 begins immediately after falling asleep, when the brain waves are low frequency alpha waves interspersed with short bursts of even lower frequency theta waves (see Figure 2). These short theta wave bursts are the first indication that the person is most likely asleep. There can be eye movements but they are much slower than those of REM sleep. However, the person is only very lightly asleep and is very easy to wake up. If awoken, they will sometimes believe they were not asleep. NREM1 is also the stage in which muscle twitches or muscle jerks known as hypnic jerks can also awaken the sleeper. While almost everyone has experienced hypnic jerks at some time in their life, they are relatively rare for most, although they can be a regular occurrence for a few.
Several minutes later as the sleeper transitions into NREM2 sleep, theta waves become the dominant brain wave. The occurrence of sleep spindles and K-complexes interspersed among the theta waves (seen in Figure 2) are a sure indication that the person is now asleep. Sleep spindles are short bursts of beta waves, and K-complexes are sudden high-amplitude delta waves lasting about a second. The function of the sleep spindles and K-complexes is not known. There are typically no eye movements during NREM2 and the sleeper is still easily awakened. NREM stages 1 and 2 are viewed mainly as transitions between the more important Slow-Wave and REM stages.
NREM3 (Slow Wave Sleep) contains a mixture of theta and delta waves, with at least 20% delta waves. NREM3 is considered the most important and “restful” stage of NREM sleep.
The brain waves of REM sleep are almost indistinguishable from those of NREM1 sleep. What differentiates REM sleep is not its brain wave pattern, but rather the co-occurrence of rapid eye movements, total loss of muscle tone, and of course, dreaming. As mentioned earlier, while the most intense dreaming occurs in REM sleep, dreaming is also observed in NREM sleep.
How is EEG measured?

EEG is measured by noninvasive macroelectrodes placed in standardized scalp locations. Each macroelectrode detects the voltage generated in thousands of pyramidal neurons in the outer layer of the cerebral cortex closest to the skull (See figure 3). Pyramidal neurons are large neurons with many inputs and outputs.
Action potentials in axons and graded potentials in dendrites and cell bodies generate miniscule amounts of voltage as they travel along the neuron membrane. The voltage is measured in millivolts in the neuron itself, but in even smaller microvolts when detected by an EEG macroelectrode at some distance away. However, an EEG macroelectrode is able to detect only the graded potentials of pyramidal neuron dendrites that are very close to the skull (see figure 3), the action potentials of axons are too far away.
The pyramidal neurons whose dendritic voltage is measured have their cell bodies located in cortical layers II, III, and V, while their dendrites extend into cortical layer I, the layer closest to the skull (see Figure 3). Only the voltage of those dendrites in cortical layer I, parallel and very close to the skull, are detectable. These potentials are initiated by neurotransmitters binding dendritic receptors and by retrograde potentials radiating out from the cell body.
The skull, meninges, and cerebrospinal fluid intervening between the EEG macroelectrode and the dendrites hamper voltage detection and the resulting weak signal must be strongly amplified to be useful. There are also various artifacts that can distort the signal and must be filtered out. However, when used properly, EEG macroelectrodes can provide a highly reliable index of nearby cortical activity.
How do different types of brain waves arise?
Cortical neurons, unlike most other neurons in the central and peripheral nervous system, have the unusual property of producing spontaneous electrical activity when just “hanging out and doing nothing.” In fact, the overall electrical activity of the cortex does not change much as a person passes from being awake to progressively deeper stages of sleep. There is a small decline during the deepest stage of NREM sleep, however cortical neurons are definitely not resting while you sleep! What does change significantly is brain wave amplitude and frequency.

EEG brain waves are actually a derived measure that arises by adding together the output from 2 different macroelectrodes in different scalp locations. The electrode in a specific brain location is compared against a reference electrode in a standardized location (see Figure 4). When the voltage peaks and valleys occur at the same time (i.e. electrical activity is synchronized in the 2 cortical areas), high-amplitude, low-frequency brain waves result, more typical of sleep. However, if the voltage peaks and valleys are unrelated in the 2 areas (i.e are desynchronized), low-amplitude, high-frequency brain waves more typical of an awake person will be seen (see figure 4).
The different brain waves occurring in the different sleep stages are influenced by cortical neurons called “pacemaker neurons.” Pacemaker neurons, situated throughout the cortex, can both stimulate and synchronize the electrical activity of thousands of their neighboring neurons. The deeper the stage of sleep, the stronger is their influence (for reasons that will be explained in detail in a future post). When deeply asleep, the pacemaker neurons not only cause the cortex’s unusual spontaneous activity, they also cause neurons throughout the cortex to fire in a synchronous fashion.
To understand why brain waves change during sleep and arousal, you also need to know that the brain is a parallel processor. Many different types of cortical processing can be carried out simultaneously, and independently, in different parts of the cortex. For example when actively responding to the demands of the day, some cortical areas are processing sensory input, others are engaged in memory storage and retrieval, others in performing executive function, and yet other areas in motor processing and motor output. Each cortical area can “do it’s own thing” relatively independently of, and at the same time as, other cortical areas.
As the brain becomes alert and many cortical areas become actively engaged, the pacemakers’ influence diminishes. As a result, the voltage peaks and valleys in the different cortical areas become dissimilar. The more intense and complicated the cortical processing, the more dissimilar is the electrical activity in different locations, and the more desynchronized the EEG.
REM and NREM sleep over the course of a night’s sleep
A hypnogram depicts the changes in the sleep stages over the course of a night’s sleep. Figure 5 is a representative hypnogram. When a person falls asleep, they normally enter NREM1 sleep. They then typically progress rapidly through the other NREM stages until reaching stage 3 around 20 minutes later (there can be variability). The first REM bout typically begins after about an hour of sleep.
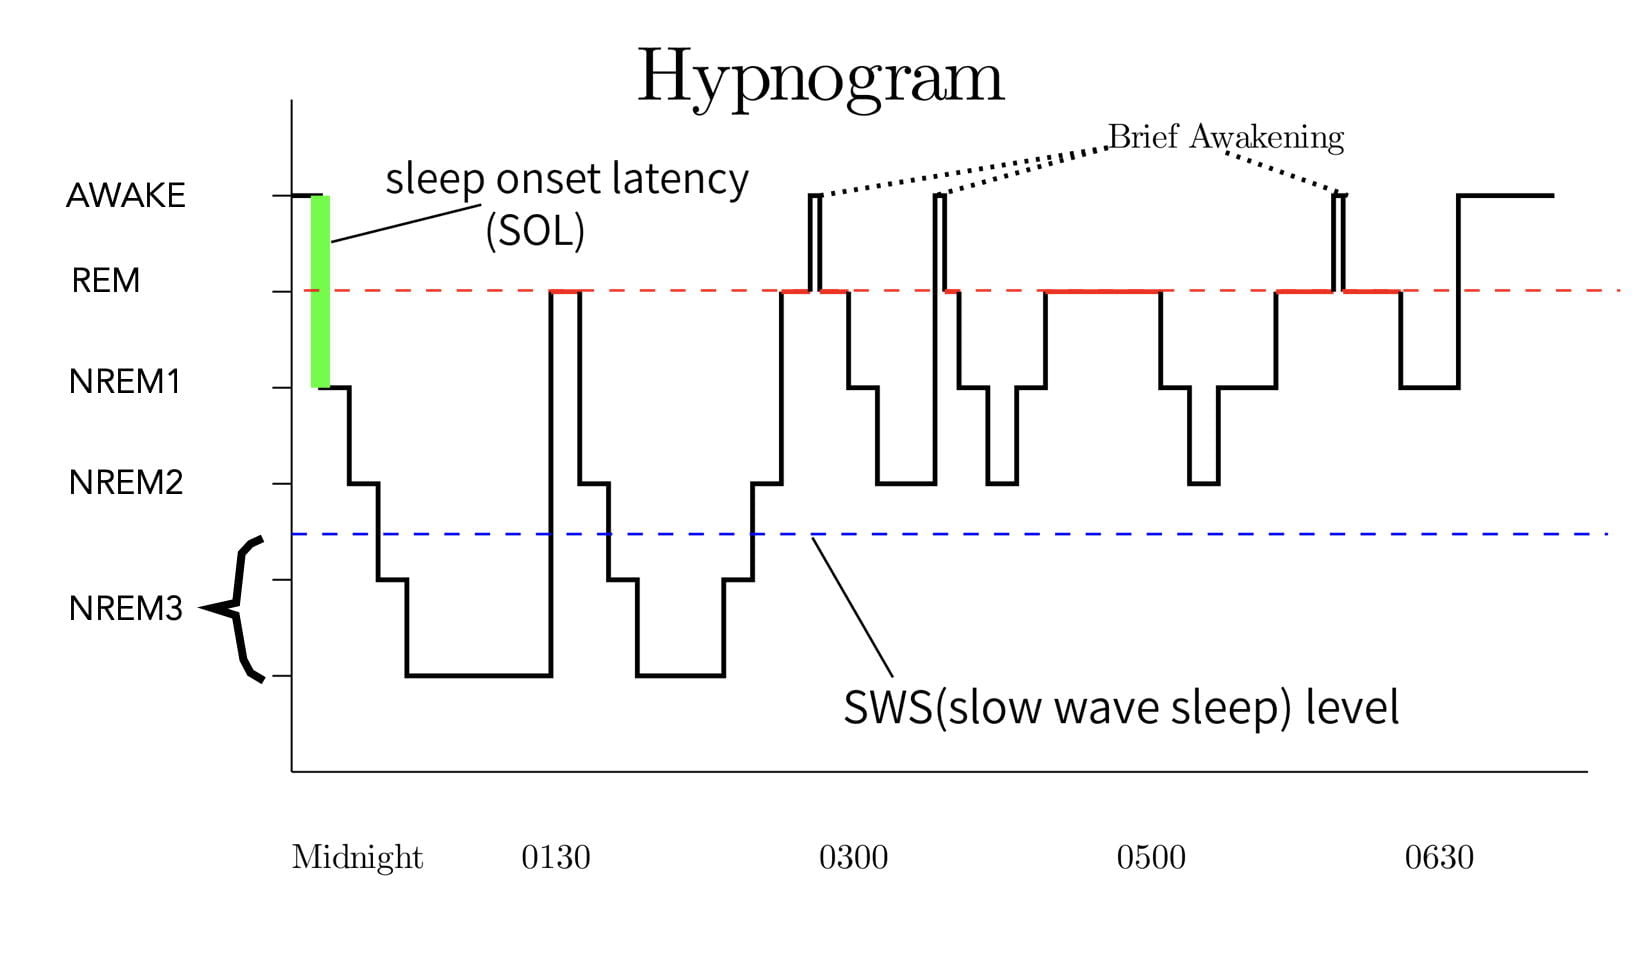
As mentioned earlier, sleep stages follow a cyclic pattern with each cycle consisting of a period of NREM sleep followed by a period of REM sleep. Each cycle lasts approximately 90 minutes, a type of ultradian (less than 24-hour) rhythm. In an adult, there are around 3 to 6 cycles per night (the person in Figure 5 had 4 complete cycles.). REM sleep typically accounts for around 20-25% of each cycle in an adult.
Many other physiological processes also exhibit ultradian rhythms. Some processes, such as testosterone and corticosterone secretion, have similar 90-minute rhythms, while other ultradian rhythms can be longer or shorter. Ultradian rhythms, like the 24-hour circadian rhythm, are thought to be controlled by biological clocks.
As mentioned earlier, sleep researchers consider REM and Slow Wave Sleep (NREM stage3) to be the most important types of sleep. Interestingly, the occurrence and intensity of REM and Slow Wave Sleep are inversely related over the course of the night. As seen in the hypnogram, Slow Wave Sleep typically occurs early in the night’s sleep, while REM bouts become longer and more intense toward the end of the night’s sleep.
Another interesting issue is that REM sleep is followed by a refractory period. That is, after a REM bout has ended, REM sleep can not reoccur until after a certain amount of NREM sleep intervenes. The exact cause is not known.
Falling asleep, like the co-occuring changes in EEG, appears to be a gradual process. However the transitions from NREM sleep to REM sleep appear almost instantaneous. This abruptness indicates the existence of a “on/off” or “flip/flop” switch mechanism, analogous to a light switch, controlling this change. When on, this switch instantly shifts you from NREM to REM sleep. The REM-Sleep Executive Mechanism appears to be located in the primitive brain stem (more about this in a later post).
Concluding Remarks.
EEG has certainly provided scientists with a window into the workings of the brain during sleep. While there is still a lot we don’t know, scientific research has begun to unravel some of sleep’s mysteries. Future posts will explore the known functions and neurological mechanisms of sleep.
Further Reading.
A great deal of this information can be found in Wikipedia under the topics: Electroencephalography and Rapid Eye Movement Sleep. More importantly for students writing papers, these Wikipedia articles have extensive bibliographies for pursuing the information in greater depth. While I consider Wikipedia a fantastic resource for familiarizing yourself with a topic, I personally would not allow it a citable resource.


