Depression IX: A Glutamatergic Hypothesis of Depression

Introduction.

A previous post presents 5 different hypotheses for what goes wrong in the brain to cause depression.  The hypotheses are not mutually exclusive, each addressing a different aspect of this complicated disorder.  This post re-examines one of the more recent hypotheses, the glutamatergic hypothesis, which also provides the most comprehensive understanding of depression and its treatment.  According to this hypothesis, depression is ultimately caused by the malfunctioning of brain neurons that release glutamic acid as their neurotransmitter. (Hereafter glutamic acid will be referred to as glutamate, its ionic form in the brain).

The glutamatergic hypothesis arose when ketamine, a glutamate antagonist, was found in 2000, not only to treat depression quicker than first-line SSRIs (within hours vs 3-5 weeks), but was also effective in many “treatment-resistant” patients that don’t respond to SSRI’s.  At the time, this discovery was viewed as the biggest depression-treatment breakthrough in 50 years.

This post examines how maladaptive glutamate activity in the brain might lead to depression, the causes of maladaptive glutamate activity, and how some new findings might lead to better antidepressant drugs. 

Background on Glutamate. 

Although glutamate was not recognized as a neurotransmitter until the early 1980’s, we now know that it is the most common, and most important, neurotransmitter in the brain.  Glutamate is the brain’s principal excitatory neurotransmitter with its large myelinated neurons providing the primary basis for transmitting and encoding complex information.  In fact, Sanacora et al. (2012) refer to the brain as “largely a glutamatergic excitatory machine.”  In the human cortex and limbic system, around 80% of the neurons and 85% of the synapses are excitatory with the vast majority being glutamatergic.  This glutamatergic circuitry is central to the complex neural processing underlying learning, memory, cognition, emotion, and consciousness.  The other 20% of neurons and 15% of synapses are inhibitory and serve mainly to modulate the excitatory circuitry.   Given its anatomical ubiquity and functional importance, it makes sense that dysfunctional glutamate signaling might play a central role in depressive illness.

In what follows I present a model for how the glutamatergic hypothesis of depression might work.  Since research on humans to support many aspects of this hypothesis is lacking, some interpretive leaps between research on humans and non-human animals are necessary to make everything fit together.  So, a healthy skepticism is warranted.

Although glutamate is present in our diet (both as a component of protein and as a free amino acid) dietary sources do not contribute much to the glutamate that neurons use as a neurotransmitter. This is because the blood brain barrier is largely impermeable to glutamate (and glutamine, its precursor).  Instead, the brain’s glutamate depends mainly on the synthesis of glutamine from glucose inside astrocytes, a type of glia cell in the brain.  The glutamine can then be transferred to glutamate neurons for conversion to glutamate.  Figure 1 below illustrates the synthesis of glutamate, its packaging into vesicles, its release into the synapse, its removal from the synapse, and its recycling.

Figure 1. A schematic showing the synthesis, vesicular packaging, release, and recycling of the glutamate (i.e. glutamic acid) used as a neurotransmitter in the brain.  See the text for more details.

Glutamate is synthesized inside glutamate neuron terminals.  To get into the synaptic vesicle, glutamate is actively transported across the vesicle membrane by vesicular glutamate transporters (VGLUTs), proteins embedded in the vesicle membrane.  In contrast to most other small neurotransmitters which possess only a single type of vesicular transporter, glutamate has three (VGLUTs 1, 2, & 3).  Once inside the vesicle, the glutamate is released into the synapse by the vesicle membrane fusing with the presynaptic membrane.

Following release, glutamate can bind to a variety of postsynaptic and presynaptic glutamate receptors in a “lock and key” fashion in which glutamate’s 3-dimensional shape fits precisely into the receptor site.  Similar to other neurotransmitters, glutamate possesses high receptor specificity and low receptor affinity.  This means that while glutamate binding is specific for glutamate receptors, binding does not last very long.  After binding, glutamate quickly falls off its receptors and is rapidly removed from the synapse to terminate its activity. If not removed, glutamate would continue to rebind its receptors, which, as explained below, can have negative consequences.

Glutamate also has a more complex system for its synaptic removal than other neurotransmitters.  Large neurotransmitters (such as peptides) often simply diffuse out of the synapse, while many small neurotransmitters are removed by a single type of transporter that moves them back into the presynaptic terminal (a process called reuptake).  As seen in figure 1, glutamate. like other small neurotransmitters, undergoes reuptake by a single type of transporter (EEAT3).  However, reuptake accounts for only a small fraction of the glutamate removal. In fact, the numerous EEAT1 and EEAT2 transporters in astrocytic endfeet are responsible for around 80% of the glutamate removal (Gulyaeva, 2017; Haroon et al., 2017).  There are also 2 other transporters (EEAT3 and EEAT4) that move glutamate  into the postsynaptic neuron.  Much of the removed glutamate can eventually be reused (Mother Nature is a great recycler!).

So why does “Mother Nature” expend extra effort on glutamate synaptic-vesicle packaging and synaptic removal?  One reason is to insure the success of glutamate’s critical role in information transmission.  In order to be released into the synapse, glutamate must first be packaged into synaptic vesicles.  Multiple vesicular transporters optimize this process.  Once released into the synapse, information is encoded in the magnitude and frequency of “pulses” of glutamate release.  However, for a glutamate pulse to be detected by postsynaptic receptors, the previous pulse must be quickly removed (synaptic concentrations can change dramatically in milliseconds!).  The many synaptic transporters optimize the success of this critical process.

A second important reason for the complex glutamate infrastructure is because glutamate differs from most neurotransmitters in being “excitotoxic!”  Paradoxically, extended high concentrations in the brain can “poison” and, in extreme cases, kill neurons!  According to the glutamatergic hypothesis, glutamate excitotoxicity is the initial process that leads to depression (and can play a role in other neurological disabilities as well).

Fortunately there are tightly regulated features that normally protect against glutamate excitotoxicity.  One feature, already described, involves the multiple transporters for synaptic removal.   As mentioned in other posts, the more important a biological process is to survival, the more likely it is to have redundant backup systems.

Also protective are other types of neurons whose neurotransmitters inhibit glutamate activity.  Most important in the brain are the Gamma Amino Butyric Acid (GABA) neurons, with GABA being the brain’s principle inhibitory neurotransmitter.  (Paradoxically glutamate is also a precursor in the synthesis of GABA inside GABA terminals.)  Like glutamate neurons, GABA neurons are found throughout the brain and often synapse onto glutamate neurons.  Their major role is to tamp down glutamate activity to prevent glutamate neurons from becoming too active.  Glycine, plays the same role in the spinal cord where it replaces GABA as the principal inhibitory neurotransmitter.  So a balance between GABA/glycine inhibition and glutamate excitation is essential to keeping the glutamate circuitry in check.

Other neurotransmitters also participate.  Depending upon who you talk to, there may be over 100 “secondary” neurotransmitters in the brain.  The neurons releasing these neurotransmitters typically have 2 features in common: 1) they are regional in distribution and 2) almost all are inhibitory.   These neurons help GABA neurons further refine glutamate activity in particular brain areas.

Glutamate synapses also have another unusual feature.  Unlike most other synapses, glutamate synapses are enclosed by the endfeet of astrocytes (see figure 1).   In addition to clearing glutamate from the synapse, these endfeet have the added benefit of preventing glutamate from leaking out of the synapse and inappropriately stimulating neighboring neurons and glia.

Despite all the safeguards, given the right circumstances, the glutamate system can still become overactive.  This overactivity could be due to a variety of factors including excessive synaptic release, low synaptic removal, or alterations in postsynaptic receptor sensitivity.  Regardless of cause, depression is thought to be one of the outcomes.

Mechanism of excitotoxicity.

So how does glutamate release cause excitotoxicity?  The “big picture” is that glutamate receptor binding opens calcium channels in postsynaptic neurons.  When open, calcium, more prevalent in the extracellular fluid, flows to the inside of the postsynaptic neuron. This entry activates intracellular enzymes, boosting various aspects of cellular metabolism.

While some boosting is essential to normal functioning, like so many things in life, too much of a “good thing” is bad.  Excessive overstimulation can exhaust the neuron’s energy resources and also produce metabolic waste faster than it can be removed.  Over time this excitation impairs the neuron’s functioning and, in extreme cases, can cause neuron death.  Impaired glutamate functioning also adversely affects other types of neurons and glia cells which further contributes to depression symptomology.  As the depression worsens, the individual shows signs of lessened glutamate activity (Moriguchi et al, 2019) and brain damage (Zhang et al., 2017). Fortunately, some of the changes appear reversible if the depression is effectively treated.

Now that you have the big picture, it’s time to get a little nerdy.  If you’d rather not, feel free to skip the next section.

Molecular events involved in  excitotoxicity.

There are actually 4 classes of glutamate receptors: 1) AMPA 2) Kainate, 3) NMDA, and 4) Metabotropic (also referred to as G-protein coupled receptors).  AMPA stands for α-amino-3-hydroxy-5-methyl-4-isoxazolepropionic acid, Kainate stands for Kainic acid, and NMDA stands for N-Methyl-D-aspartic acid. For obvious reasons, I’ll stick to abbreviations.

AMPA, Kainate, and NMDA receptors are structurally very similar, each composed of 4 proteins that join together to form a protein complex stretching across the postsynaptic membrane.  Each protein complex was named for the glutamate analog (AMPA, NMDA, or kainite) that selectively binds only its own receptor complex and not the other complexes.  In fact this selective binding provided the initial evidence that these 3 receptor complexes are actually different.

AMPA, Kainate, and NMDA receptors are also referred to as ionotropic receptors because the protein complex contains not only a glutamate binding site but also an ion channel through the postsynaptic membrane (see figure 2 below).  When glutamate binds its binding site, the channel almost instantaneously opens, and when glutamate falls off its binding site, the channel almost instantaneously closes. The opening and closing of the ion channel is caused by slight changes in the shape of the protein complex.  To further complicate the situation, some of the contributing protein subunits have multiple isoforms (i.e. slightly different amino acid sequences) resulting in “subtypes” for each type of receptor.  The subtypes are sometimes differentially expressed in different parts of the brain (and in different individuals).  These subtypes may contribute to differences in susceptibility to excitotoxicity in different brain areas, and in different individuals.

In addition there are 8 different metabotropic glutamate receptors found in postsynaptic membranes and as autoreceptors in presynaptic membranes (autoreceptors provide feedback to the presynaptic terminal allowing it to adjust its release).  For the metabotropic receptors, the receptor and the ion channel are separate membrane proteins in which several steps intervene between glutamate binding and opening/closing the channel.  Consequently metabotropic ion channels are somewhat slower to open and, once open, remain open somewhat longer.

A glutamate synapse typically contains a mixture of ionotropic and metabotropic receptors, with receptors found both postsynaptically and presynaptically.  There’s definitely a lot going on in glutamate synapses!

Two postsynaptic glutamate receptors that can cause excitoxicity are the NMDA and Kainate receptors.  However, since the conventional perspective has been that ketamine exerts its antidepressant effect through binding the NMDA receptor, most of the scientific attention has been on it. The NMDA receptor is also much more widely expressed in the brain and more is known about it.  (In fact, the NMDA receptor may be the brain’s most studied neurotransmitter receptor since its functioning is also central to how the brain “rewires” itself to encode memories, a story for another day.)

In general, ion channels can be opened in one of two ways: 1) chemically gated: by neurotransmitters or neurohormones binding a receptor site or 2) electrically gated: by changes in membrane voltage (either depolarization or hyperpolarization depending upon the channel).  However, the NMDA ion channel is unique in being both electrically and chemically gated!  This reminds me of an old Saturday Night Live skit where a salesman was selling a product that was both a floor wax and a mouthwash. 😀  Like that product, the NMDA receptor/channel complex is two products for the price of one!

Before explaining the steps involved in opening the NMDA ion channel, you need to know that when a neuron membrane is just hanging out, doing nothing, it exhibits what’s called a resting potential.  At the resting potential, the inside of the membrane is negatively charged with respect to the outside because of the unequal distribution of 4 ions dissolved in the fluids on the two sides of the membrane.  Sodium (Na+) and chloride (Cl-) are more common outside the neuron in the extracellular fluid, while potassium (K+) and protein anions (A-) are more common in the cytoplasm.  Sodium, potassium and chloride ions all have their own channels that, when open, allow them to pass through the cell membrane.  However,  the protein anions, which are synthesized inside the neuron, are much larger in size and are trapped inside the neuron.  At the resting potential the ion channels are closed, and with slightly more negative ions inside the neuron and slightly more positive ions outside,  there is a small voltage difference across the membrane (-70 mV on the inside with respect to the outside).

There are also other ions in the brain’s fluids, but they occur in much lower concentrations and, as a result, do not contribute much to the resting potential.  For example, one of these ions, calcium (Ca++) is more prevalent outside the neuron.  Despite its low concentration, calcium entry into the postsynaptic neuron is the critical event that can cause excitotoxicity and depression (according to the glutamatergic hypothesis).  

Figure 2 illustrates the numbered steps involved in glutamate opening the NMDA calcium ion channel that lead to excitoxicity.   For reference, the relative distributions of the relevant ions are seen in the boxes.

Figure 2. A schematic illustrating the steps involved in glutamate causing calcium entry into postsynaptic neurons.  See text for more description.

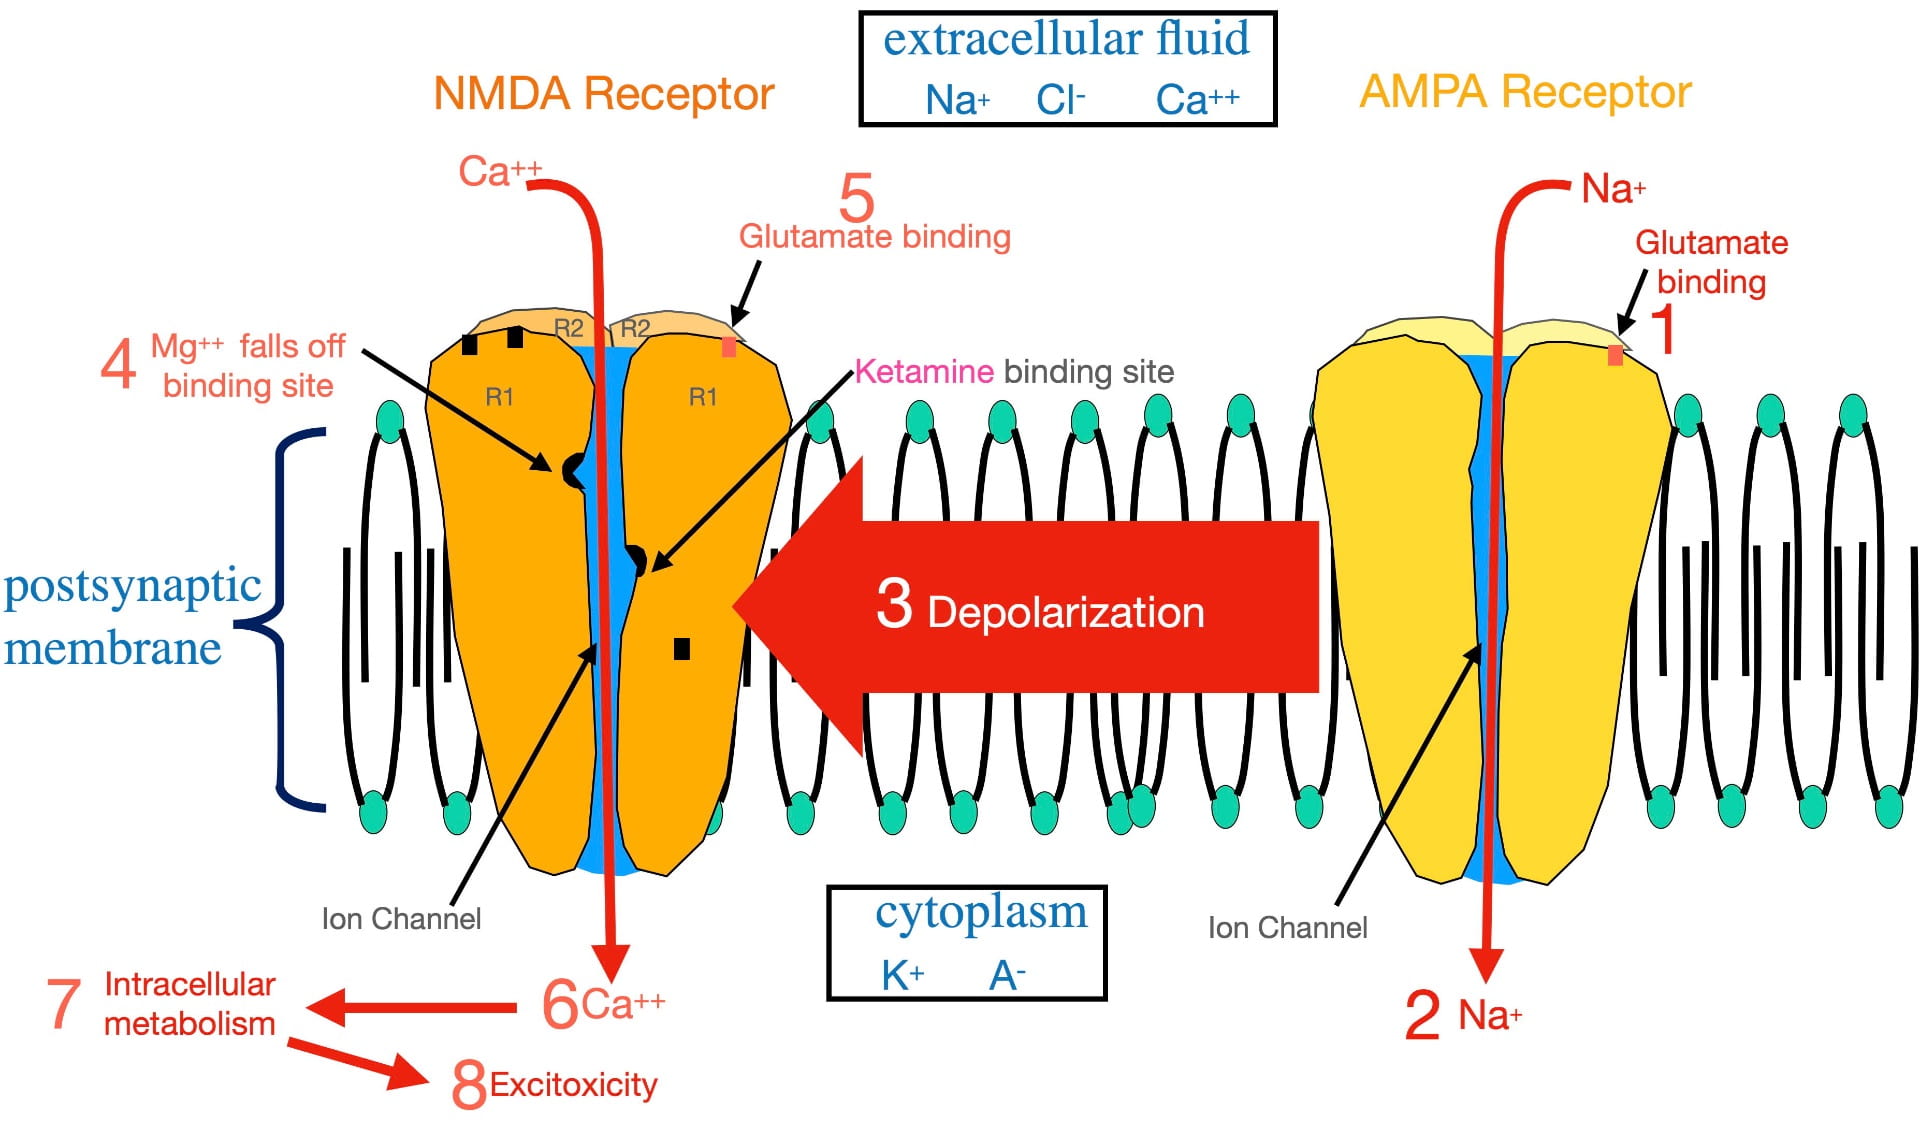
Glutamate cannot open the NMDA ion channel when the postsynaptic membrane is at the resting potential. In order to open this ion channel, the membrane must first become depolarized.   This depolarization is accomplished by glutamate binding AMPA receptors present in the same postsynaptic membrane (step 1).  The AMPA complex contains an ion channel that is selective for sodium.   Glutamate binding opens the AMPA sodium channel allowing sodium to flow to the inside (step 2), depolarizing the membrane.

This depolarization then radiates out along the membrane as a graded potential (step 3).  (A graded potential is one that loses voltage as it travels.) However, over the microscopically short distances involved, when the graded potential reaches an NMDA receptor, it is still sufficiently depolarized to dislodge a magnesium ion bound inside the NMDA ion channel (step 4).  When the magnesium ion binds its site, it physically blocks ion flow.  Once removed, glutamate binding  (step 5)  can open the ion channel.

Once the NMDA channel is opened, calcium passes through the channel to the inside of the postsynaptic neuron (step 6).  As described earlier, this entry stimulates intracellular metabolism (step 7).  This activation of intracellular metabolism is further augmented by the release of calcium from endoplasmic reticulum storage inside the neuron.  If there is chronic overstimulation, excitotoxicity (step 8) can result.

To complicate matters, the NMDA “calcium” channel is not very selective.  When open, not only calcium, but also sodium can flow to the inside, while potassium can flow to the outside.   However, the movement of these other ions electrically cancel each other out, resulting in only a small effect on membrane voltage.  The important outcome, illustrated in figure 2,  is the calcium entry!  (Not exactly the way I would design this channel, but it obviously does the job).

As mentioned earlier, the strongest evidence supporting the glutamatergic hypothesis is the effective treatment of depression with subanesthetic doses of ketamine.  Ketamine’s antidepressant effect has historically been thought to occur by ketamine attaching to a binding site inside the ion channel separate from the magnesium site (shown in figure 2).   By binding the ketamine binding site, ketamine physically blocks the NMDA channel (in much the same way as magnesium) and prevents glutamate from opening the channel .  In other words, ketamine appears to treat depression by blocking calcium entry. (This blockade is also the basis for ketamine’s anesthetic property.)  However, another perspective in the last section of this post presents an intriguing alternative explanation of ketamine’s antidepressant effect.

How does glutamate excitotoxicity bring about depression?

The Glutamatergic Hypothesis assumes that depression is ultimately caused by a breakdown in the functioning of glutamate communication in the brain.  The various symptoms of depression are thought to arise mainly from the inability of different parts of the brain to interact normally.  This section attempts to explain how these changes come about, drawing on research from non-human animals as well as humans.

Psychiatrists agree that Major Depressive Disorder is precipitated and maintained by psychological stress with depression-prone individuals having a heightened stress response.  This stress response involves the increased release of adrenal glucocorticoids from the adrenal cortex (Moica et al, 2016).  These hormones (such as cortisol in humans and corticosterone in some other species) are essential to life, affecting virtually every cell in the body.  However, under conditions of stress, glucocorticoid release is substantially elevated.  One effect of heightened release is to increase glucose availability, the preferred fuel of all cells of the body (hence the name, glucocorticoid).   A second effect is to suppress inflammation in the body by dampening the immune system.  In this way, glucocorticoids help individuals cope with the stress.

While adaptive in the short-term, an extended stress response is maladaptive. Continued high levels of glucocorticoids deplete the body’s energy resources and eventually impair, rather than help, the body’s functioning.  The weakened immune system increases susceptibility to infection.

Glucocorticoids also readily cross the blood brain barrier where they affect both neurons and glia.  One of the outcomes is that glutamate neurons increase their synaptic activity.  Similar to events outside the brain, the increase in glutamate activity is likely beneficial in the short term, but in the longer term can lead to glutamate excitoxicity and depression.

The reduction in brain-derived neurotrophic factor (BDNF) in the brain’s extracellular fluid occurs along with glutamate hyperactivity.  BDNF is a protein synthesized by glia and neurons (Khoodoruth et al., 2022) and is released into the extracellular fluid, where it binds  mainly non-synaptic receptors on glutamate neurons.  This binding promotes the health, neuroplasticity, and general functioning of glutamate neurons.  The lowered BDNF availability further contributes to glutamate neuron dysfunction.  In the hippocampus, BDNF also appears essential for neurogenesis (more about that below).  In animals, the type of glutamate dysfunction seen in human depression can be corrected with BDNF administration, suggesting BDNF would be a powerful antidepressant! Unfortunately, BDNF does not cross the blood/brain barrier, preventing its use in humans.

However the causal relationship between glutamate activity and BDNF activity is complex (Gullyaeva, 2016).  Animal research has shown that cause and effect can operate in both directions.  That is, glutamate malfunctioning can cause BDNF levels to drop, while decreased BDNF levels can cause glutamate malfunctioning.  So which occurs first in the chronology of depression is not clear.  (This ambiguity as well as the importance of BDNF in depression has given rise to a separate BDNF hypothesis of depression.)  It is worth mentioning that BDNF decreases are also seen in other neurodegenerative diseases such as Parkinson’s disease, Alzheimer’s disease, multiple sclerosis and Huntington’s disease.

While there is some loss of the brain’s glutamate neurons during depression, the more significant effect appears to be a loss in glutamate synapses (as measured by a loss of dendritic spines).  This loss results in a maladaptive remodeling (i.e. “rewiring”) of the glutamatergic circuitry both within and between various brain structures (Sancora et al., 2012).  Again, the more critical factor  is thought to be the impaired ability of  the cortex and limbic system to work together in a coordinated fashion to regulate emotion and cognition. 

Malfunctioning in glutamate neurons can cause dysfunction in other neurons as well.  This dysregulation can, in turn, can feed back on glutamate circuitry further contributing to glutamate dysfunction.  For example GABAergic dysfunction also is seen during depression (Fogaca, 2023) suggesting that its normal inhibitory regulation of glutamate neurons is affected.  Maladaptive glutamate functioning could also contribute to the low monoamine (serotonin, norepinephrine & dopamine) activity in depressed individuals, which in turn contributes to glutamatergic dysfunction.  It seems likely that many other neurotransmitter systems also would be affected.

As mentioned earlier, glia cells are also adversely affected during depression.   Since oligodendrocytes provide the myelin (“white matter”) that speeds up axonal action potentials, oligodendrocyte dysfunction affects the speed and timing of  glutamatergic communication.  Also the nurturance of glutamate axons by myelin is disturbed.   

Astrocyte dysfunction during depression contributes through its roles in glutamate removal from synapses, in preventing glutamate”leakage” out of the synapse, and also in the biosynthesis of both glutamate and GABA.  Astrocytes also contain a substantial amount of glutamate extracted from glutamate synapses.  Normally, this glutamate is converted to glutamine and transferred to neurons to participate in glutamate (and GABA) biosynthesis.  (see Figure 1 for glutamate synthesis).  However, during depression, some of this glutamate can “leak out” of dysfunctional astrocytes  further contributing to glutamate’s excitotoxicity.  Microglia also become increasingly activated during depression to help the brain cope with the increased levels of inflammation (Harcon et al., 2017).  

Just as neurons communicate with each other, astrocytes, oligodendroglia and microglia also communicate with each other to coordinate their contributions to glutamate functioning.   During depression this inter-glial communication can also become disturbed, further contributing to glutamate dysfunction (Harcon et al., 2017).

Some MRI or CAT scan studies report that depressed individuals experience a small shrinkage in certain brain areas, reflecting a loss of both grey and white matter.  Although there are study differences, the affected areas can include the frontal lobe, hippocampus, temporal lobe, thalamus, striatum, and amygdala (Zhang et al., 2018).   Zhang et al. (2018) suggests that the differences in different studies may be related to the length and severity of the subjects’ depression.  Again, the shrinkage doesn’t appear to be caused as much by neuron loss as it is by the loss of glutamate terminals and dendrites (contributing to grey matter loss) and the loss of oligodendrocytes (contributing to white matter loss).

Perhaps the most consistent finding is the shrinkage of the hippocampus (Malykhin & Coupland, 2015).  Shrinkage by as much as 20% has been seen in some severely depressed patients (giving rise to the Hippocampal Hypothesis of Depression).  However, the hippocampus is thought to have a unique feature that affects its shrinkage.  Many neuroscientists believe the hippocampus to be the only area of the adult human brain that engages in neurogenesis (the birth of new neurons).  All the other brain areas contain only neurons that were present at birth.

Neurogenesis leads to 2 neuronal populations in the hippocampus.  One population resembles the long-lived neurons in other parts of the brain.  If they die, they are not replaced.  The other population is shorter lived and is constantly being replaced by neurogenesis, keeping their numbers relatively constant throughout life.  (It is thought that this population plays an important role in making the new synaptic connections throughout life that support the hippocampus’s role in memory formation.)  During depression, the drop in  BDNF levels causes hippocampal neurogenesis to become impaired.  The resulting shrinkage is thought to be caused mainly by the short-lived neurons not being replaced as quickly as they are lost.   The resulting dysfunction is thought to give rise to the Alzheimers-like memory problems seen in many severely depressed individuals.

The good news is that brain shrinkage appears to be at least partially reversible by successful depression treatment.  The bad news is that the more severe and long lasting the depression, the more refractory it is to available treatments.

Is Depression actually multiple disorders with overlapping symptoms?

One puzzling feature of unipolar depression is that patients often vary somewhat in primary and secondary symptoms.  According to the DSM5 (the Diagnostic and Statistical Manual of the American Psychiatric Association), a patient must possess 5 or more of 8 depression symptoms to be diagnosed as suffering from Major Depressive Disorder (MDD). The patient must exhibit one of the 2 primary symptoms, either a depressed mood or anhedonia (i.e. an inability to experience reward).   The remaining secondary symptoms can include weight loss or gain, feelings of worthlessness, feelings of guilt, fatigue, lack of concentration, anxiety, memory problems, and suicidal thoughts. The symptom variability seen from patient to patient has led to the idea that depression may not be a single disorder but rather multiple disorders with overlapping symptoms.

However the glutamatergic hypothesis can potentially explain different symptom profiles.  The different symptoms, are to some extent, caused by malfunctioning in different parts of the brain, all of which depend upon glutamate functioning.  It is possible that different brain areas have different susceptibilities to dysfunction in different patients, accounting for different profiles.  At the same time, the idea of multiple disorders masquerading as a single disorder cannot be entirely ruled out.

Implications of the Glutamatergic Hypothesis for treatment.

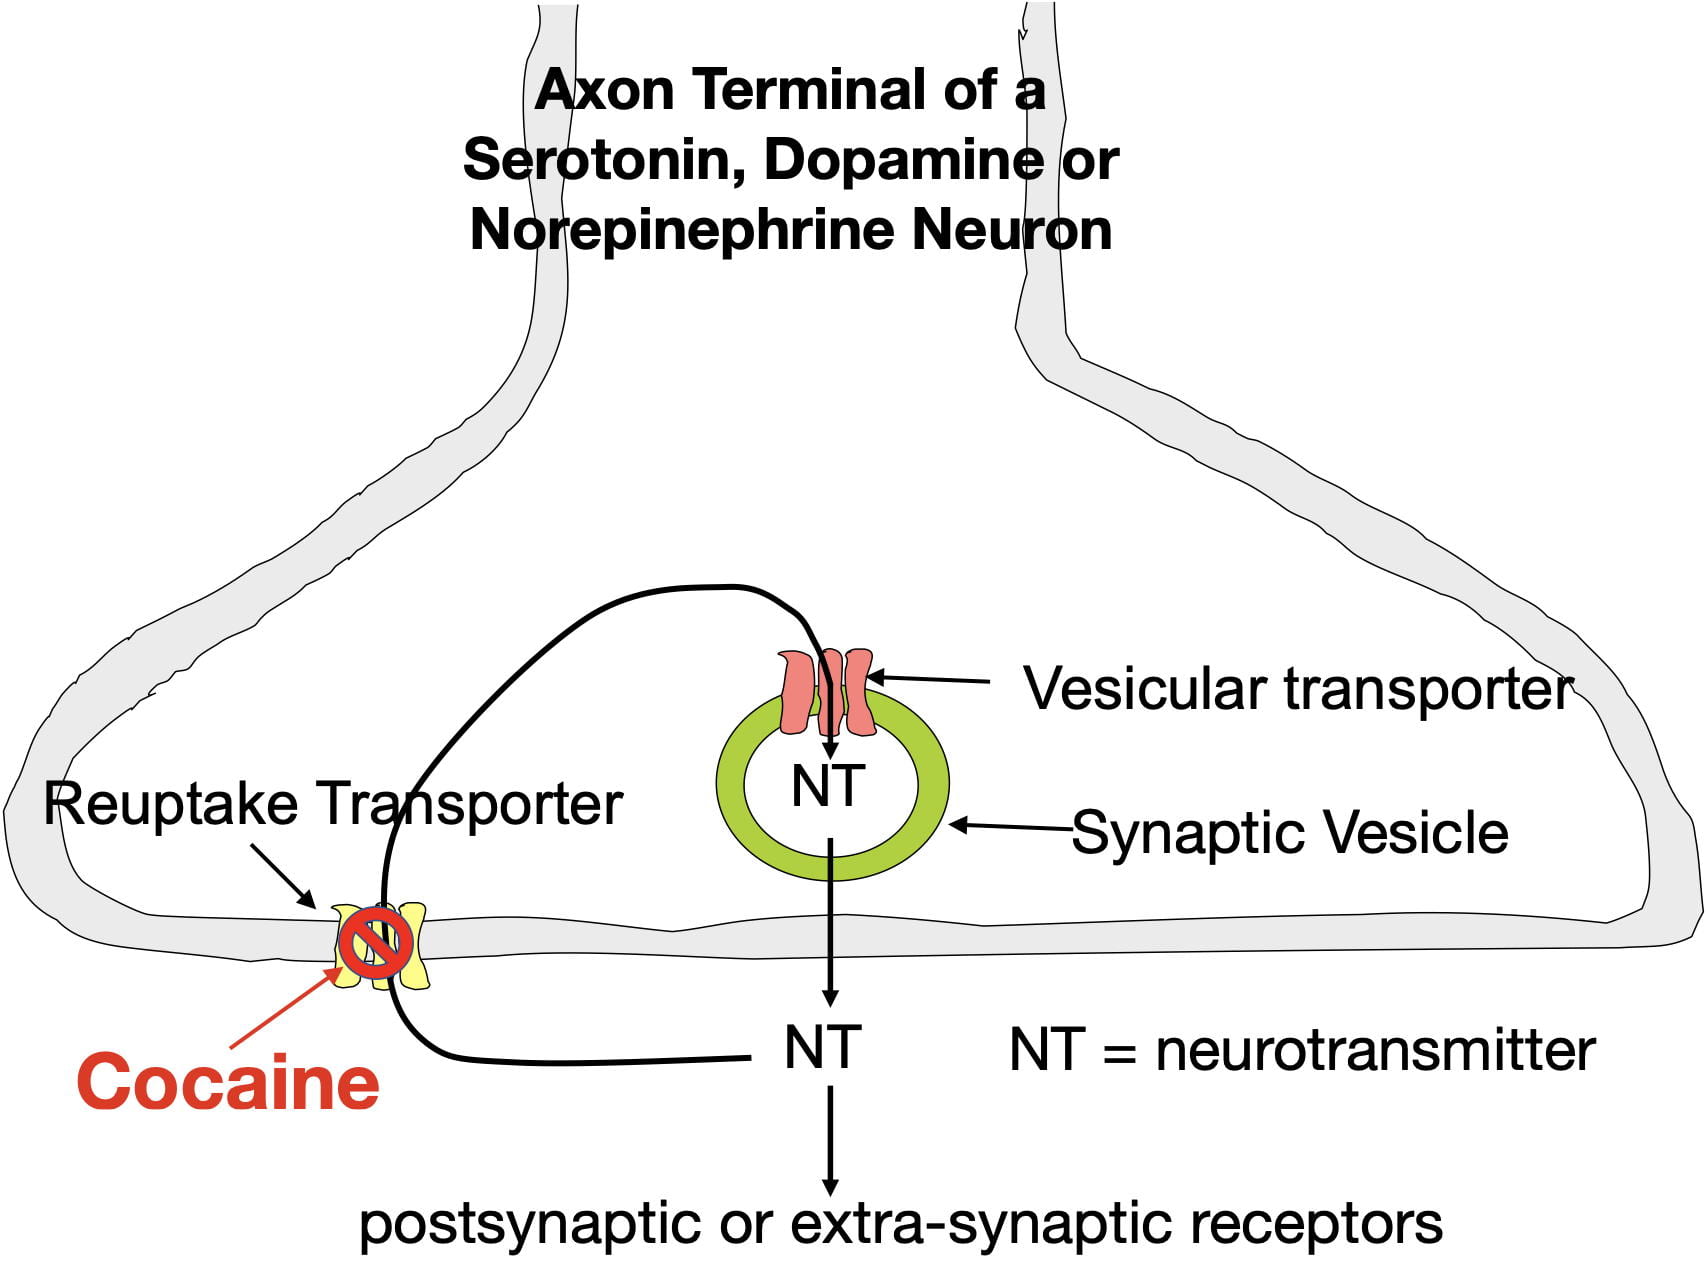
According to the glutamatergic hypothesis, the brain’s glutamate system is considered the final common pathway for all depression treatments (Sancora et al., 2012).  Conventional thinking for the 3 major classes of antidepressants has been that ketamine affects glutamatergic dysfunction directly by blocking NMDA receptors, SSRI’s (e.g. fluoxetine, citaloram, escitalopram, and others) work indirectly by blocking serotonin reuptake transporters, and monoamine psychedelics (e.g. psilocybin, LSD and ayahuasca) work indirectly by initially activating a type of serotonin receptor (5-HT2A ).

But that may not be all, folks!   Sanacora et al. (2012) cites evidence that drugs that interact with AMPA receptors, as well as drugs that interact with certain glutamate metabotropic receptors, may also have antidepressant qualities.  In addition, Negrete-Diaz et al., (2022) suggest that kainate receptors might be involved in depression as well.  Ideally, a drug, or drug combination, that addresses multiple aspects of glutamatergic functioning might work the best.  If the technical issues of delivery could be solved, perhaps BDNF, which is beneficial for both neurons and glia, or a BDNF-analog drug would be ideal. 

Just as I was getting ready to push the “publish” button for this post, I came across a recent publication by Moliner et al. (2023) that provides a potentially “paradigm-shifting,” alternative explanation of how antidepressants affect glutamateric circuitry!  These authors provide evidence that the three major classes of antidepressant drugs all work by binding a type of BDNF receptor called TrkB (Tropomyosin receptor kinase B).  In other words, the current antidepressant drugs may already be BDNF analogs of sorts!  From this perspective, NMDA receptors, serotonin reuptake transporters, and 5-HT2A receptors would more likely be associated with the drug’s side effects.

Consistent with this perspective, previous work (Casarotto et al., 2021) demonstrated that both SSRI’s and ketamine exhibit low affinity TrkB binding.   However, Moliner et al. (2023) found that  psilocybin and LSD, both of which have antidepressant properties, bind the TrkB receptor with a 1000-fold higher affinity (Moliner et al., 2023).  Although direct comparisons of the effectiveness of different classes of antidepressant drugs are lacking, these findings seem congruent with subjective impressions of antidepressant effectiveness.  For example, ketamine appears better than SSRI’s both in terms of speed of action (hours vs weeks) and in the number of patients that respond (many patients respond to ketamine that don’t respond to SSRIs). The monoamine psychedelics also act quickly in many patients unresponsive to SSRIs.  However, while the ketamine antidepressant effects last around a week in most patients, the effects of the monoamine psychedelics often appear to last for months or longer.

However, Moliner et al., 2023, found that psilocybin and LSD don’t work exactly like BDNF.  Rather these drugs bind the TrkB receptor at a different site than BDNF allowing them to serve as allosteric modulators of the TrkB receptor.  In doing so, these drugs slightly change the shape of the TrkB receptor, making it more sensitive to endogenous BDNF (Moliner et al., 2023).  Presumably this increased sensitivity would allow the low levels of BDNF present during depression to be sufficient to correct the glutamatergic dysfunction and treat the depression.  Furthermore you would expect drugs that bind TrkB with high affinity (such as psilocybin) would produce quicker and more lasting relief than drugs that bind with low affinity (such as SSRIs).  Furthermore, if the antidepressant and psychedelic binding sites are distinct, it might be possible to develop powerful new antidepressant drugs that are not psychedelic!

However the significant positive correlations between the antidepressant effects of psilocybin, ayahuasca, and ketamine and their psychedelic effects observed in many studies (Mathai et al.,2020; Ko et al., 2022) could be used to argue against the likelihood of developing non-psychedelic antidepressants. These correlations don’t invalidate the possible therapeutic importance of TrkB binding.  However, if the correlations are caused by the same part of the molecule binding both the “psychedelic” receptor site and the TrkB receptor, it may be impossible to separate the two effects.

Further complicating the situation, another recent finding (Sanacora, & Colloca, 2023) is consistent with ketamine’s psychedelic effect causing its antidepressant activity.   In this study, patients were ingeniously prevented from experiencing ketamine’s psychedelic effect by administering it when depressed patients were unconscious from general anesthesia for surgery.  Under these circumstances, ketamine was no better than a placebo at reducing depression symptoms.  How this finding can be reconciled with the hypothesized importance of TrkB binding isn’t clear.

It would be very informative to similarly “mask” the psychedelic effect of psilocybin during depression treatment.  Unfortunately such an attempt would be difficult (and probably unethical) since the duration of its psychedelic effect  (around 6 hours) is much longer than that of ketamine (around an hour).

It’s now time to throw up our collective hands and utter the common response to ambiguous scientific situations, “more research is needed!”

Conclusion.

The evidence is compelling that depression is related to the malfunctioning of the brain’s glutamateric circuitry.  At the same time questions remain as to exactly how antidepressant drugs interact with this circuitry.  It will be interesting to see how this all plays out over the next few years.  Stay tuned!

References Consulted.

All the references below contain information that made contributions to my post.

Alnefeesi, Y., Chen-Li, D., Krane, E., Jawad, M. Y., Rodrigues, N. B., Ceban, F., . . . Rosenblat, J. D. (2022). Real-world effectiveness of ketamine in treatment-resistant depression: A systematic review & meta-analysis. Journal of Psychiatric Research, 151, 693-709. doi:10.1016/j.jpsychires.2022.04.037

Casarotto, P. C., Girych, M., Fred, S. M., Kovaleva, V., Moliner, R., Enkavi, G., . . . Castren, E. (2021). Antidepressant drugs act by directly binding to TRKB neurotrophin receptors. Cell, 184(5), 1299-1313.e19. doi:10.1016/j.cell.2021.01.034

Fogaca, M. V., & Duman, R. S. (2019). Cortical GABAergic dysfunction in stress and depression: New insights for therapeutic interventions. Frontiers in Cellular Neuroscience, 13, 87. doi:10.3389/fncel.2019.00087

Gulyaeva, N. V. (2017). Interplay between brain BDNF and glutamatergic systems: A brief state of the evidence and association with the pathogenesis of depression. Biochemistry.Biokhimiia, 82(3), 301-307. doi:10.1134/S0006297917030087

Haroon, E., Miller, A. H., & Sanacora, G. (2017). Inflammation, glutamate, and glia: A trio of trouble in mood disorders. Neuropsychopharmacology : Official Publication of the American College of Neuropsychopharmacology, 42(1), 193-215. doi:10.1038/npp.2016.199

Hawkins, R. A. (2009). The blood-brain barrier and glutamate. The American Journal of Clinical Nutrition, 90(3), 867S-874S. doi:10.3945/ajcn.2009.27462BB

Khoodoruth, M. A. S., Estudillo-Guerra, M. A., Pacheco-Barrios, K., Nyundo, A., Chapa-Koloffon, G., & Ouanes, S. (2022). Glutamatergic system in depression and its role in neuromodulatory techniques optimization. Frontiers in Psychiatry, 13, 886918. doi:10.3389/fpsyt.2022.886918

Ko, K., Knight, G., Rucker, J. J., & Cleare, A. J. (2022). Psychedelics, mystical experience, and therapeutic efficacy: A systematic review. Frontiers in Psychiatry, 13, 917199. doi:10.3389/fpsyt.2022.917199

Malykhin, N. V., & Coupland, N. J. (2015). Hippocampal neuroplasticity in major depressive disorder. Neuroscience, 309, 200-213. doi:10.1016/j.neuroscience.2015.04.047

Mathai, D. S., Meyer, M. J., Storch, E. A., & Kosten, T. R. (2020). The relationship between subjective effects induced by a single dose of ketamine and treatment response in patients with major depressive disorder: A systematic review.Journal of Affective Disorders, 264, 123-129. doi:10.1016/j.jad.2019.12.023

Moica, T., Gligor, A., & Moica, S. (2016). The relationship between cortisol and the hippocampal volume in depressed patients – a MRI study. Procedia Technology, 22, 1106-1112.

Moliner, R., Girych, M., Brunello, C. A., Kovaleva, V., Biojone, C., Enkavi, G., . . . Castren, E. (2023). Psychedelics promote plasticity by directly binding to BDNF receptor TrkB. Nature Neuroscience, 26(6), 1032-1041. doi:10.1038/s41593-023-01316-5

Moriguchi, S., Takamiya, A., Noda, Y., Horita, N., Wada, M., Tsugawa, S., . . . Nakajima, S. (2019). Glutamatergic neurometabolite levels in major depressive disorder: A systematic review and meta-analysis of proton magnetic resonance spectroscopy studies. Molecular Psychiatry, 24(7), 952-964. doi:10.1038/s41380-018-0252-9

Onaolapo, A. Y., & Onaolapo, O. J. (2021). Glutamate and depression: Reflecting a deepening knowledge of the gut and brain effects of a ubiquitous molecule. World Journal of Psychiatry, 11(7), 297-315. doi:10.5498/wjp.v11.i7.297

Pitsillou, E., Bresnehan, S. M., Kagarakis, E. A., Wijoyo, S. J., Liang, J., Hung, A., & Karagiannis, T. C. (2020). The cellular and molecular basis of major depressive disorder: Towards a unified model for understanding clinical depression. Molecular Biology Reports, 47(1), 753-770. doi:10.1007/s11033-019-05129-3

Sanacora, G., & Colloca, L. (2023a). Placebo’s role in the rapid antidepressant effect. Nature Mental Health, 1(11), 820-821. doi:10.1038/s44220-023-00141-w

Sanacora, G., Treccani, G., & Popoli, M. (2012). Towards a glutamate hypothesis of depression: An emerging frontier of neuropsychopharmacology for mood disorders. Neuropharmacology, 62(1), 63-77. doi:10.1016/j.neuropharm.2011.07.036

Sapolsky, R. M. (2001). Depression, antidepressants, and the shrinking hippocampus. Proceedings of the National Academy of Sciences of the United States of America, 98(22), 12320-12322. doi:10.1073/pnas.231475998

Sheline, Y. I. (2011). Depression and the hippocampus: Cause or effect?  . Biol. Psychiatry, 70(4), 308-309.

van Velzen, L. S., Kelly, S., Isaev, D., Aleman, A., Aftanas, L. I., Bauer, J., . . . Schmaal, L. (2020). White matter disturbances in major depressive disorder: A coordinated analysis across 20 international cohorts in the ENIGMA MDD working group. Molecular Psychiatry, 25(7), 1511-1525. doi:10.1038/s41380-019-0477-2

Wang, H., He, Y., Sun, Z., Ren, S., Liu, M., Wang, G., & Yang, J. (2022). Microglia in depression: An overview of microglia in the pathogenesis and treatment of depression. Journal of Neuroinflammation, 19(1), 132-0. doi:10.1186/s12974-022-02492-0

Zhang, F., Peng, W., Sweeney, J. A., Jia, Z., & Gong, Q. (2018). Brain structure alterations in depression: Psychoradiological evidence. CNS Neuroscience & Therapeutics, 24(11), 994-1003. doi:10.1111/cns.12835

https://wordpress.lehigh.edu/jgn2


Depression VIII: Will the FDA Approve Psilocybin as an Antidepressant?

Where am I going with my many blogs on drug treatments for depression?

If you’ve been reading my previous posts, this is a question you may be asking yourself.  In fact, that is a question I’m also asking myself.  My answer is…….I’m not entirely sure.

Although I had originally envisioned writing only 3 or 4 posts on depression, I’m now up to 8.  My initial posts were largely a rehash of old lecture information that I had assembled for classes I taught.  However, as the posts progressed and I began examining issues on which I had not lectured, I had to rely more on recent publications (both scientific journal articles and news reports).  Fortunately, or unfortunately, the more I read, the more issues I find to be nerdy about.

A science fiction writer I like described himself as a “pantser” when designing his stories.  He describes two general writing strategies.  Some writers plot the story line in advance and then fill in the details as they write.  The other approach he describes as “flying by the seat of your pants” (i.e. “pantser” approach) in which the writer doesn’t think too far ahead and lets the story line go in whatever direction seems appropriate and interesting.  I definitely fall in the pantser category of blog writing.  Eventually I will get somewhere, but I’m not exactly sure where that “somewhere” will be, or how I will get there.  My approach is also influenced by the random stops and starts by which the leading edge of science normally proceeds.

Although psilocybin has already been approved for therapeutic use in Oregon, and can be used on a limited experimental basis elsewhere in the U.S., psilocybin has not been officially approved by the federal government.  Psilocybin remains in the DEA Schedule 1 category, supposedly making it illegal for any purpose.  Psilocybin’s status appears similar to marijuana which is approved for therapeutic and recreational use by many states, although considered illegal by the federal government.

In this post I present some of the issues relevant to the DEA and FDA granting federal approval for psilocybin as a therapy for depression (although it may be therapeutic for other purposes as well).  I  also issue the disclaimer that I am not an “insider” in the psychedelic treatment of depression and much of what I present here comes from my general knowledge of pharmacology as well as from reading some of the relevant literature.  Although much of what I present is pretty straightforward, you should take my opinions at the end “with a grain of salt.”

Introduction.

As discussed in the previous post, the three classical, serotonin-like, psychedelics that have been used most often in treating depression are LSD, psilocybin, and ayahuasca.  However much of this work, mainly with LSD, was performed in the 1950’s and 1960’s before these drugs became illegal.   While this early evidence supported therapeutic effectiveness, the research designs employed did not use modern research methods, allowing for alternative explanations.

Since 2018, when psilocybin received FDA breakthrough status, scientists have been reinvestigating psychedelics using randomized clinical trials, the linchpin of modern drug research (more about this later).  In this regard, Reiff et al. (2020) identified 14  well-designed studies that investigated the effectiveness of psychedelic drugs for treatment-resistant depression, anxiety, end-of-life issues, and PTSD.  This post will draw on this work, with an emphasis on psilocybin, since it is currently the only  serotonin-like psychedelic FDA-approved for limited experimental use.  Reiff et al.’s (2020) review supports psilocybin’s antidepressive effects being both quicker and longer lasting than traditional monoamine antidepressants for many patients.

(While not covered in this post, the FDA has also provided break-through status for a catecholamine-like psychedelic, MDMA, for the experimental treatment of PTSD, putting its status in a similar state of bureaucratic limbo.)

While the FDA has not yet reached a decision on whether to legalize psilocybin for general therapeutic use, the state of Oregon already finds the evidence convincing.  In November 2020, Oregon approved the use of psilocybin for state-wide therapeutic use by licensed professionals!   I had not been following these developments at the time and when I read about Oregon’s decision in the New York Times , I was a bit surprised by how quickly Oregon made their decision.

History and Pharmacology of Psilocybin use.

First a bit of background.   A more detailed account is found in the previous post.

There is evidence that indigenous peoples began using psilocybin for religious and therapeutic purposes before recorded history.  For example, cave paintings depicting a dancing Shaman with a bee-like head and mushrooms sprouting from his body date human use to as early as 3500 BC.  However an awareness of psilocybin by Western Culture didn’t really begin until Thomas Wasson wrote an article in Life Magazine in 1957 and coined the term “magic mushroom.”   In the 1960’s, Timothy Leary became one of the early pioneers in both the scientific and recreational use of psychedelics although his advocacy of unregulated recreational use clearly contributed to the banning of these drugs by the government.  Nonetheless, following this banning, some psychiatrists and scientists continued to strongly advocate for therapeutic use.

Psilocybin (and its derivative, psilocin) are plant alkaloids made by a number of different mushroom species (in multiple genera).  The mushrooms can be eaten raw, brewed as a tea, or cooked.  The chemical structure of psilocybin was identified in 1958, and now can be readily synthesized in pharmaceutical laboratories eliminating the need for mushroom cultivation.  Synthetic psilocybin allows for more precise dosage control and virtually all recent FDA-approved clinical studies have used synthetic psilocybin.

Once in the body, psilocybin is enzymatically converted into psilocin, the active form of the molecule.  Although less potent  than LSD (i.e. requires a higher dosage for effectiveness), psilocybin’s psychedelic efficacy is almost identical.  In other words you can produce the same psychedelic effects with psilocybin as LSD, you just need a larger dosage.  Psilocybin’s side effects of dizziness, nausea, and vomiting are also similar to LSD.  However these side effects are transitory and generally well tolerated in both therapeutic and recreational settings.

Why psilocybin rather than LSD or ayahuasca?

LSD, ayahuasca, and psilocybin all appear therapeutic in treating depression with many more published studies examining LSD than the other two.  So why is psilocybin turning out to be the preferred psychedelic? It turns out that psilocybin has advantages over both LSD and ayahuasca.  

An advantage over ayahuasca is because psilocybin can be synthesized allowing for precise dosage control.  Ayahuasca, on the other hand, is a plant-based preparation containing a host of other ingredients which may vary a bit from preparation to preparation, and which is administered as a tea, making dosage control more difficult.  In addition, once the active molecule in ayahuasca, dimethyltriptamine (DMT), enters the blood it is readily destroyed by an enzyme (monoamine oxidase) before it can enter the brain to exert its effects.  However, in ayahuasca, DMT’s destruction is blocked by monoamine oxidase inhibitors also present in the ayahuasca.  Like psilocybin,  DMT can be synthesized in a pharmaceutical laboratory, however, pure DMT presents the complication of possibly needing additional drugs to reliably obtain desired effectiveness.  More research is necessary to clarify this point.

When comparing LSD and psilocybin, the  important considerations  are potency, efficacy, and therapeutic index.  Potency refers to the dosage necessary produce the effect.  Efficacy refers to the magnitude of the effect that a drug can achieve.  The therapeutic index is calculated from a knowledge of potency and efficacy and reflects the drug’s safety margin.  LSD and psilocybin appear approximately equally effective as psychedelics.  However, LSD is much more potent and exerts its effects at a much lower dosage.  In fact, LSD is the most potent of ALL known synthetic drugs!

Although it may seem counterintuitive, drugs that combine low potency with high efficacy have a high therapeutic index.  The reason is that the dosage difference between when first showing effectiveness and when maximally effective is always greater for low-potency drugs.   Consequently low-potency drugs have a larger safety margin when you don’t get the dosage exactly right.  (This relationship also explains why fentanyl, with its very high potency , is now the leading cause of preventable death in the the current U.S. opiate epidemic.  Although other opiates can also kill you, fentanyl’s low therapeutic index makes it much easier to accidentally overdose.)

Procedures For Legalizing Psilocybin (and MDMA) For Nationwide Therapeutic Use.

Two federal agencies are tasked with approving and regulating drugs.  Although their goals are different, they typically work together in reaching final judgements.  The Drug Enforcement Agency (DEA), part of the Department of Justice, is concerned with categorizing and enforcing the legality of drugs according to their perceived harm/therapeutic value.  After reviewing the evidence, the DEA places a new drug into one of five Schedules ranging from Schedule 1 (no accepted use) to Schedule 5 (over-the-counter and relatively safe prescription drugs).  The DEA is also the lead agency for policing the proper use of drugs domestically as well as coordinating and pursuing U.S. drug investigations abroad.

The Food and Drug Administration, on the other hand, is part of the Department of Health and Human Services, and is concerned with insuring that new therapeutic drugs are both effective and safe.  To that end, any new drug must first be tested with animals for general pharmacology and toxicity as well effectiveness in animal models of the human disorder.  If the animal testing looks good, the drug can then be approved for experimental human testing in 3 successive phases.  Phase 1 is a preliminary test of safety in which 20 to 80 healthy volunteers are given the drug and toxicity/metabolism/side effects are measured.  If Phase 1 looks good, researchers can then move to Phase 2 which preliminarily tests between 20 and 300 patients for effectiveness in treating the disease condition.  If Phase 2 looks good, Phase 3 is a much more extensive test of both effectiveness and safety, typically using many more patients (200 – 3000+) as well as looking at different dosages and drug combinations as well as comparisons with other approved drugs.

Psilocybin is currently in FDA Phase-3 human trials.  The results so far appear highly promising. Ongoing and future studies are presumably to address a variety of issues the FDA sees as important.   Eventually, a panel of “experts” at the FDA will review all the evidence and evaluate whether psilocybin’s therapeutic use is acceptable, whether it should be prescription, its addictiveness, its potential for illegal use, and how psilocybin compares to other approved drugs for the same condition.  The FDA must also approve and any site where psilocybin will be manufactured.  Should the FDA decide to approve psilocybin,  the DEA must also reschedule psilocybin to a category that allows for its legal use.  Psilocybin is currently a DEA schedule-1 drug (no accepted use) and would have to be rescheduled to at least Schedule 2 (accepted clinical use with restrictions).

Randomized Clinical Trials.

In order to meet the FDA’s requirements for Clinical Trials with humans, experimenters must use modern research methods.  While some details can vary from trial to trial, all share a number of features to minimize various types of bias.  These features unfortunately were not present to the same degree in research performed in the 1950’s and 1960’s and thus the earlier studies of psychedelic effectiveness are often amenable to alternative explanations.

Selection of Subjects.  The subjects of FDA clinical trials are volunteers.  However the volunteers are screened for a number of issues before being accepted.  With respect to psilocybin treatment of depression, the subjects must be moderately to severely depressed.  This is because therapy effectiveness is more easily evaluated in more severe cases.  The volunteers should not be taking any other medications for their depression and time must have elapsed for any previous medications to be cleared from their systems.  Also volunteers should not have any other psychiatric condition that might predispose to a bad outcome.

Random Assignment to Conditions.  Trials have 2 or more treatment conditions.  The different treatment conditions might vary by dosage or some other aspect of the treatment protocol.  Ideally you want all extraneous variables that might influence the outcome (i.e. level of depression, anxiety level, age, sex, etc)  equally represented in all treatment conditions.  Random assignment to treatment conditions statistically accomplishes this goal, particularly with the large sample sizes used in most clinical trials.  With small sample sizes (under 12 per treatment condition) it may be necessary to match subjects into conditions as best you can.

Crossover Designs.  Most clinical trials now allow all subjects to receive the psilocybin treatment, but at different times.  Advance knowledge that they will eventually receive treatment has the added advantage of increasing subject participation.

Subjects are randomly assigned to treatment and non-treatment conditions for the first phase of the trial.  Differences in this phase provide the main data for analyzing the therapeutic effects of the psychedelic.  However, after this first phase is complete, subjects previously in non-treatment conditions are then given the psychedelic.  This procedure provides additional before-and-after assessments to provide a secondary evaluation of therapeutic effects.

“Blinding” of both subjects and experimenters.  Knowledge of treatment condition by either the subject, or by the “hands-on” experimenters can potentially bias the outcome of the study.  To attempt to remove this bias, both subjects and experimenters must be “kept in the dark” while the experiment is underway.  Only after the experiment is completed are the subjects and experimenters allowed to know which subjects were treated and which were not.  Unfortunately, as explained below, it is impossible to do a totally “blind” study using psychedelics.

Use of a placebo. Drugs are notorious for producing “placebo effects” (i.e. effects determined not by the drug but by a subject’s expectations).  Consequently it is usually necessary to have a placebo control condition which ideally differs from the drug treatment only in possessing no therapeutic value.  If subjects don’t know whether they are receiving the drug or the placebo, random assignment should insure that the two groups have comparable expectations.  The effects of the drug can then be contrasted with that of the placebo to determine the drug’s “true” therapeutic value.   

As mentioned above, it is impossible to have a completely valid placebo for psilocybin (or any psychedelic).  Some clinical trials use niacin as the placebo since it has no psychedelic effects but can mimic some of psilocybin’s side effects such as dizziness, nausea and vomiting.  This may fool some in the placebo condition into thinking they have received psilocybin.  However, because of psilocybin’s unmistakable psychedelic effects, everyone in the psilocybin condition, as well as the experimenters administering the psilocybin, will know who has received psilocybin.  Thus subject and experimenter bias can not be entirely eliminated.  These biases do present an issue for interpreting results.

At the same time, contrary to what many nonscientists believe, scientific research can never “prove” anything!  All research can do is gather evidence to either support or reject a hypothesis.  When the supporting evidence is sufficiently convincing to other scientists, the hypothesis becomes “accepted.”  Even with psilocybin’s built-in bias, many experts are finding the evidence convincing.

Measuring Depression and Other Relevant Dependent Variables.  Experimenters must also have objective, reliable, and valid tests to quantify depression, the dependent variable of interest.  Depression can be measured by a number of validated paper and pencil tests.  These include the Quick Inventory of Depressive Symptomology (QUIDS), the Beck Depression Inventory (BDI), the Hamilton Depression Rating Scale (HAM-D) and the Hospital Anxiety and Depression Scale (HADS).  Most experimenters utilize more than one test to assess the degree of depression.  The tests are typically administered before, during, immediately after, and often weeks-to-months after treatment, to assess immediate, short-term, and long-term effects.

The effects of psilocybin treatment on other dependent variables are often measured as well.  Since many depressed individuals also suffer from anxiety, anxiety also is typically measured by well-validated tests.

Evidence exists that the antidepressant effect of psychedelics also correlates with the magnitude of a “mystical” or “peak” experience.  Consequently, the degree to which the person has such an experience is often assessed as well.

Set and Setting.  The response to a psychedelic experience can vary widely.  At one extreme, some people have what they consider one of the best experiences of their lives.  At the other extreme, some people find the experience terrifying and, in rare cases, particularly in predisposed individuals, experience a psychotic breakdown.  Whether the psychedelic experience is positive or negative is strongly influenced by  “set and setting”.  “Set” refers to the mindset of the person taking the psychedelic and “setting” to the environment in which the psychedelic is taken.

The willingness of a depressed person to volunteer for a clinical trial likely reflects a predisposition towards a positive mindset.  However, prior to the psychedelic treatment, a positive mindset is further optimized by carefully preparing and educating the patient for what is likely to happen.  The sensory, cognitive, and potential therapeutic effects, as well as possible side effects, are all carefully explained.   If the patient can be convinced in advance that psychedelic experience is going to be positive, it almost always is.  A positive response is further optimized by a safe and pleasing setting, free from interruption.   In addition, an experienced professional is always available to guide the experience and provide needed support.  When the proper preparations are taken, a bad experience is very rare.

Dosage.  One major purpose of FDA phase-3 drug research is to develop a protocol for drug administration.  Since all therapeutic drugs have side effects that increase with increasing dosage, you want to determine the lowest dosage necessary to produce the desired therapeutic effect.  However, the ideal dosage can vary by sex, age, body weight, and other variables.  Exactly what is done in the treatment before, during, and after drug administration is also potentially important.  As you might imagine, determining the best treatment protocol requires lots of research.

Concluding Remarks.

From research already performed psilocybin is both quicker acting and longer lasting than traditional antidepressants for many patients.   If approved by the FDA, it will likely be used initially primarily for treatment-resistant patients that don’t respond to traditional antidepressants.  However, that might change if psilocybin’s effectiveness is as robust and lasting as some studies seem to indicate.  The treatment protocol will almost certainly involve medical professionals in an approved setting resulting in expensive “up-front” costs to the patient. However, FDA approval should make treatment eligible for insurance coverage.

I think that federal approval is largely a matter of having enough data exploring dosage, administration protocols, and potential side effects that FDA experts can feel confident about their decision.  In this regard, there is likely evidence being used to guide the FDA’s decision that hasn’t been published yet.   Given the prevalence of depression, the less than desirable depression treatments currently available, and the changing public attitudes towards cannabis and psychedelics, my guess is that FDA approval will happen relatively soon and that the DEA will reschedule psilocybin to make approval possible.  Just sayin’

Reference Consulted.

Reiff, C. M., Richman, E. E., Nemeroff, C. B., Carpenter, L. L., Widge, A. S., Rodriguez, C. I., . . . McDonald, W. M. (2020). Psychedelics and psychedelic-assisted psychotherapy. Ajp, 177(5), 391-410. doi:10.1176/appi.ajp.2019.19010035


https://wordpress.lehigh.edu/jgn2

Sleep VI: Get a good night’s sleep. It’s good for your brain! (Part 2: The Glymphatic Hypothesis)

INTRODUCTION.

Sleep provides both next-day and long-term benefits to brain functioning. The next-day benefits include improved alertness, memory, problem solving, planning, decision making, mood, stress relief, balance, coordination, and sensory processing.   The long-term benefits of sufficient sleep include a decreased likelihood of neurodegenerative disorders and a greater likelihood of living longer.  This post begins addressing the underlying brain processes that give rise to these benefits.

For most of the body’s organs, sleep’s benefits occur because the body is resting. Although there is an overall 25% reduction in the brain’s metabolism during sleep, the brain does not appear to be resting.  In fact, during REM sleep, the brain is often more electrically active than when awake.  So if the brain is not resting, what is it doing to benefit itself?  It is likely that multiple processes contribute to sleep’s benefits. However, it is surprising how little science knows for sure.  While there are a number of hypotheses, most are educated guesses.

This post examines a recently discovered process, unique to sleep, that protects against the development of neurodegenerative disorders and likely also contributes to day-to-day brain functioning.

A PROBLEM (AND A SOLUTION?).

Despite being around 2% of a person’s body weight, the brain accounts for around 20% of the body’s metabolism.  Because of its high metabolism, the brain produces a lot of metabolic waste. If not removed, the waste can become toxic and, over time, poison the brain’s neurons.  The brain can take care of some of this waste through “recycling.”  However the remainder needs to be removed.  Fat-soluble waste capable of passing through the blood/brain barrier can be removed by the capillaries of the circulatory system.  Some water-soluble waste can also be removed this way by virtue of being transported across the blood/brain barrier by selective transport mechanisms.  However a substantial amount of  waste can not cross the blood/brain barrier and must be removed by some other process.  The lymphatic vessels of the immune system, which are capable of removing this waste, do not enter the brain.  So, exactly how this waste might be removed was not understood until relatively recently.

In a series of 4 papers published in 2012/2013, Maiken Nedergaard proposed a process that operates primarily at night during the deepest stage of sleep that removes metabolic waste that can’t be removed by the circulatory system. Nedergaard named the process the glymphatic system because its waste-transporting vessels are produced by a type of glia cell unique to the brain (called an astrocyte) that function like lymphatic vessels outside the brain.  Since 2012 over 1000 publications have examined different aspects of the glymphatic hypothesis.

A BRIEF ASIDE BEFORE PROCEEDING.

One of the things I learned from studying the philosophy of science many years ago is that while the scientific method can disprove a hypothesis, it can not prove one.  All science can do is gather supportive evidence.  When the totality of evidence is overwhelmingly supportive, the hypothesis is normally accepted (but not proven).  While I am not an expert on the brain’s fluid dynamics, I find the evidence for the glymphatic hypothesis in a recent review (Bohr et al., 2022) pretty convincing.  My bias in this post is to accept the glymphatic hypothesis.  At the same time I note that there are scientists who interpret the findings differently (e.g.  Hladky & Barrand, 2022).  While I will briefly mention some of the disagreements, I will not be cover them  in detail.  But do keep in mind that even accepted hypotheses can later be rejected or modified in light of new evidence.

SOME BACKGROUND (BLOOD AND CEREBROSPINAL FLUID).

Since the glymphatic hypothesis depends upon movement of fluids and solutes among 4 interconnected fluid compartments, some background will be presented first.  The 4 fluids that participate are: 1) the blood, 2)  the cerebrospinal fluid (CSF), 3) The intracellular fluid of the brain’s cells, and 4) the interstitial (or extracellular) fluid between the brain’s cells.

Let’s begin with fluid movement between the blood and the CSF.   The blood compartment is found within the arteries and veins while the ventricles and meninges house the CSF.   As illustrated in the left side of figure 1, the ventricles consist of 4 interconnected cavities within the brain. Each cerebral hemisphere has its own lateral ventricle, while further down the brain, the third and fourth ventricles occur in the brain’s midline.  The meninges, also seen in figure 1, are between the brain and skull and between the spinal cord and vertebrae.

Figure 1:  The left side shows a schematic of the the ventricles and meninges of the human brain.  The right side shows a schematic of the different layers of the meninges.  CSF is found in the ventricles, subarachnoid space of the meninges, and central canal of the spinal cord.

While the blood and the CSF are normally prevented from exchanging fluid, there are two sites at which directional fluid exchange can occur: the choroid plexi of the ventricles and the arachnoid granulations of the meninges.  The highly vascularized choroid plexi are embedded in the walls of each of the 4 ventricles and produce CSF by filtering blood, with the blood/brain barrier operative in this filtering.  The resulting CSF is a clear watery liquid, similar to blood plasma (the liquid part of the blood without the red and white blood cells) but with much of the plasma’s protein and fatty acids also filtered out.  As the CSF is produced, it is released into, and fills, the ventricles.

The continuous production of CSF by all 4 ventricles results in directional flow through the ventricles (as illustrated by the red arrows of figure 1). The CSF flows from the lateral ventricles to the third ventricle via a passageway called the Foramen of Munro.  The CSF of the third ventricle flows to the fourth ventricle via a passageway called the Cerebral Aqueduct.

From the Fourth Ventricle, CSF flow continues into 2 additional structures.  As seen in figure 1, CSF flows into and fills the Subarachnoid Space of the Meninges via passageways called the Foramen of Lushka and the Foramen of Magendie. In addition, CSF also flows into and fills the Central Canal of the Spinal Cord.

Because CSF is continuously produced, it must be continuously removed in order to maintain a constant volume of around 125 ml (4 oz).   The Arachnoid Granulations embedded in the Arachnoid Layer of the Meninges perform the task of removal.  The heavily vascularized Arachnoid Granulations resemble Choroid Plexi but perform the opposite task of moving fluid from the CSF back into the blood.  There are also granulations at the lower end of the spinal cord that do the same.

The production, flow, and removal of CSF are very active processes.  CSF has a half-life of only around 3 hours and is completely turned over around 4 to 5 times each day.  If CSF is removed slower than produced, a condition called hydrocephalus (“water on the brain”) results.  This condition occurs most often in newborns and the elderly.  In this condition, hydrostatic pressure compresses the brain both from ventricles outward and from the meninges inward.  If not promptly treated the compression can cause brain damage.  In newborns, the compression can actually decrease the size of the brain and, because the skull is not yet ossified, enlarge the size of the head (a story for another day).

In addition to its role in glymphatic system functioning, CSF also performs other important functions.  For example, CSF minimizes the occurrence of concussions by serving as a hydraulic cushion between the brain and the skull.  The spinal cord is similarly protected.  CSF also reduces pressure at the base of the brain.  Since the brain is largely lipid and CSF is largely water, the brain “floats” in the meninges’ CSF, reducing its effective weight from around 1500 grams to around 50 grams.

There is little controversy about the fluid dynamics I have described so far.

THE BRAIN’S TOXIC WASTE.

While proteins are  critical for brain functioning, they are also a major source of the brain’s water-soluble waste.  A protein’s function is determined both by its amino acid sequence and how it folds into the appropriate 3-dimensional shape.  Once synthesized and properly folded, proteins serve as receptors, membrane channels, membrane pumps, structural proteins, enzymes, neurotransmitters, and neurohormones.  However, proteins are not forever.  In fact, many brain proteins are functional for only a few days.  When they cease to function, they become “waste” and must be gotten rid of (and replaced).  If a dysfunctional protein, or its degradation products, are allowed to accumulate, either inside the neuron or in the brain’s interstitial fluid, they can aggregate into “plaques.”  Over time, these plaques can become toxic and contribute to the development of neurodegenerative diseases.

In order to get rid of dysfunctional proteins, the cell is usually able to break them down into smaller units, typically a mix of peptides (protein fragments) and amino acids.  The amino acids can be recycled to make new proteins (mother nature is a great recycler).  However, the water-soluble, non-recyclable protein and peptide waste must be removed from the brain by some process other than by the circulatory system.  

THE WORKINGS OF THE GLYMPHATIC SYSTEM.

My explanation of glymphatic functioning draws heavily from Bohr et al. (2022), a review cowritten by 19 scientists  to share their understanding of the glymphatic system. This paper reviews what is known (and not known) about the glymphatic system and also proposes directions for future research and clinical application.

As seen in  Figure 2, the first step involves the cellular waste being released by neurons (and glia) into the surrounding interstitial fluid.  Once released, the glymphatic system can begin the process of removal.  As mentioned earlier, the glymphatic system is largely inactive while awake and becomes functional primarily during the deepest stage of sleep (NREM3) that normally occurs during the first ⅓ of the night’s sleep.  A 30-year-old typically gets around 2 hours of NREM3 sleep per night.   On the other hand, septuagenarians like myself often experience as little as 30 minutes of NREM3 sleep each night.

As illustrated in figure 2, The proposed directional flow of fluid through the glymphatic system is illustrated by the large black arrows.  The brain’s surface arteries initially run in the Pia Mater of the Meninges. Once the arteries leave the Pia Mater to penetrate the brain, astrocytes inside the brain send out projections called end feet that link together to form the arterial glymphatic vessels concentrically arranged around the arteries.   Astrocytes also do the same around veins leaving the brain, forming the venous glymphatic vessels.  The glymphatic vessels are also referred to as perivascular channels and perivascular spaces.

The unidirectional flow of fluid through the glymphatic system begins with the entry of CSF from the Subarachnoid Space into the arterial glymphatic vessels (see figure 2).  Once in the arterial glymphatic vessel, CSF flow is directionally driven by pulsatile blood flow through the artery in the center of the glymphatic vessel.  The fluid in the arterial glymphatic vessels, in turn, leaves these vessels by entering the interstitial fluid through a type of water channel called an aquaporin-4 channel. These one-way channels occur only in the outer walls of the glymphatic vessels and appear critical to glymphatic functioning. Genetic manipulations in mice that impair the performance of these water channels also impair waste removal while manipulations that enhance their functioning promote waste removal.

Figure 2: A schematic of the workings of Glymphatic System in removing water-soluble metabolic waste from the brain.  Cerebrospinal fluid from the subarachnoid space flows into and fills the arterial glymphatic vessels.  Fluid flows out of the arterial glymphatic vessels via aquaporin channels into the interstitial fluid.  The interstitial fluid flows directionally from the arterial glymphatic vessels to the venous glymphatic vessels.  The neurons and glia of the brain release their waste products into the interstitial fluid.  The interstitial fluid along with metabolic waste enters  the venous glymphatic vessels aided by aquaporin channels.  The venous glymphatic vessels release their fluid and waste back into the cerebrospinal fluid of the subarachnoid space where the waste can be picked up by lymphatic vessels located in the dura mater.  The waste can then be transported into lymph glands of the immune system where it can be acted upon and ultimately excreted.

According to the glymphatic hypothesis, the interstitial fluid is thought to flow convectively from arterial glymphatic vessels to venous glymphatic vessels as illustrated by the black arrows of figure 2.  In the process, the interstitial fluid picks up the metabolic waste released by the neurons and glia and transports it to the venous glymphatic vessels.   The venous glymphatic vessels then absorb interstitial fluid with it’s metabolic waste, also aided by aquaporin-4 water channels. The directional flow in the venous glymphatic vessels is also thought to be driven by blood flow; however, in this case, the more even blood flow of the central veins.  A Wikipedia animation of waste removal can be seen here.

The venous glymphatic vessels then release their waste-containing fluid back into the cerebrospinal fluid of the subarachnoid space of the meninges. There may also be efflux into the subarachnoid space by glymphatic vessels that run in the cranial nerves.  

The last step involves waste removal from the subarachnoid space by the lymphatic vessels of the immune system.  As mentioned earlier, the immune system does not enter the brain.  However, in 2014, it was discovered that the immune system’s lymphatic vessels do participate in the brain’s water-soluble waste removal although they have a indirect way of doing so.  Although lymphatic vessels don’t penetrate the brain, they do penetrate into the dura mater of the meninges.  As seen in figure 2, this is close enough for lymphatic vessels to absorb waste  from the subarachnoid space and transport it to lymph glands in the neck where it can be acted on by the immune system.  Eventually the lymphatic system releases the waste into the circulatory system for excretion.

While awake, the glymphatic system is thought to be inefficient at waste removal because the small volume of interstitial fluid impedes interstitial fluid flow. Now comes the strangest aspect of glymphatic functioning (for me anyway)!  During NREM3 sleep, the brain’s neurons and glia actually shrink in size by expelling some of their intracellular fluid into the interstitial fluid.  As a result, the volume of the brain’s interstitial fluid expands by as much as 24%!  This expansion is thought to facilitate interstitial fluid flow, enhancing waste removal.  This expansion appears to be initiated by the delta EEG waves of NREM3 sleep.   Anesthetic drugs that promote delta waves similarly increase interstitial fluid volume.  In fact these drugs are now being considered as experimental therapies for elderly individuals with problems in experiencing NREM3 sleep.

(Hladky and Barrand (2022) argue that waste movement through the interstitial fluid is more by diffusion than fluid flow.  Hladky and Barrand (2022) also argue that there is not good evidence for fluid flow in the venous glymphatic vessels and suggest that there could be efflux (as well as influx) via arterial glymphatic vessels and yet other mechanisms.  The differences between Hladky and Barrand (2022) and Bohr et al (2022) are not that the water-soluble waste isn’t removed but rather in the possible methods by which it occurs.)   

CONSEQUENCES OF BRAIN WASTE ACCUMULATION.

Regardless of exactly how waste removal is accomplished, if protein waste is not removed, it can poison neurons and, over time, cause neurodegenerative disorders.  Which disorder develops is determined both by the type of waste that accumulates and the location in the brain where the accumulation occurs.  For example, Alzheimer’s Disease is associated with the accumulation of two “waste” proteins, beta amyloid in neuronal cytoplasm and tau protein in the interstitial fluid of the forebrain.  Parkinson’s disease is associated with the aggregation of alpha synuclein protein into Lewy Bodies in the cytoplasm of neurons in the midbrain, while Huntington’s, with fragments of a mutated form of the Huntington Protein in the cytoplasm of the forebrain. Other neurodegenerative disorders may be similarly caused.

The typical late age of onset of both Alzheimer’s and Parkinson’s Diseases is thought to be related to the diminished effectiveness of waste removal during aging.   Huntington’s disease, which often has a younger age of onset, is caused by an inability  to dispose of fragments of the genetically mutated Huntington Protein.  While reduced glymphatic functioning often isn’t the central cause, it can permit genetic or environmental predispositions to better express themselves.

The brain has an incredible amount of redundancy built into its structure, so a significant number of neurons need to die before behavioral or cognitive symptoms become obvious.  Consequently, the continued accumulation of waste for some time is usually necessary to precipitate obvious long-term symptoms of neurodegenerative disorders.  At the same time, Bohr et al (2022) present evidence that loss of sleep for just one night has detectable effects on beta amyloid removal (a waste product associated with Alzheimers)!  Consequently, I would suggest that even the less serious short-term consequences of a single sleepless night may be affected by glymphatic functioning as well.

Impaired waste removal with aging can also contribute to other types of pathology.  A non-Alzheimer’s dementia called vascular contribution to cognitive impairment and dementia (VCID) appears enhanced by glymphatic system malfunctioning.  In this disorder, atherosclerosis of the brain’s small arterioles not only impairs blood flow to the brain, it also depresses flow in the arterial glymphatic vessels which, in turn, depresses glymphatic functioning.  Another medical problem in elderly surgical patients that may be related to reduced glymphatic functioning is the increased risk for delirium and impaired cognitive function during recovery from anesthesia.

OTHE BENEFICIAL CONTRIBUTIONS OF INTERSTITIAL FLUID FLOW.

The interstitial fluid flow of the glymphatic system also appears important for more than just removing waste!  This flow is also thought to transport important molecules through the brain’s interstital fluid to appropriate brain locations where they are needed.  These molecules include  glucose, lipids, amino acids, neuromodulators, growth factors, cytokines, and neurotransmitters involved in volume transmission. 

In addition, glymphatic flow is also thought to play a role in helping the brain monitor, and obtain feedback, from hormones and other substances in the blood.  In order for this to occur, the substances must first enter the brain.  However, protein and peptide hormones (such as insulin, glucagon, grehlin, leptin, etc) can enter only at “weak spots” in the blood/brain barrier.   Once entering the brain (often near the hypothalamus), glymphatic interstitial flow is thought to deliver these substances to appropriate brain locations for detection and monitoring.

CONCLUDING REMARKS.

There is clearly more about the glymphatic system that needs to be discovered.  Regardless of how the details turn out, the moral of this story is to regularly get a good night’s sleep, not only to function well the next day, but also to optimize your longevity and brain functioning into old age.

The next post will examine other beneficial brain processes thought to occur during sleep.

REFERENCES CONSULTED.

Bohr, T., Hjorth, P. G., Holst, S. C., Hrabetova, S., Kiviniemi, V., Lilius, T., . . . Nedergaard, M. (2022). The glymphatic system: Current understanding and modeling. iScience, 25(9), 104987. doi:10.1016/j.isci.2022.104987

Hladky, S. B., & Barrand, M. A. (2022). The glymphatic hypothesis: The theory and the evidence. Fluids and Barriers of the CNS, 19(1), 9-z. doi:10.1186/s12987-021-00282-z

https://wordpress.lehigh.edu/jgn2

Sleep V: Get a good night’s sleep. It’s good for your brain! (Part 1)

INTRODUCTION

This post describes sleep’s benefits to brain functioning while the next post (Part 2) will examine the underlying neurological processes thought to provide these benefits.

Figure 1. Effects of Sleep Deprivation on the brain and body. By Mikael Häggström, used with permission.

All you have to do to demonstrate sleep’s benefits is deprive people of sleep and observe what happens.   Almost everyone has performed this “experiment” on themselves and usually find they are not at their best the next day.   The symptoms can include: moodiness/grumpiness, problems in concentrating and problem solving, problems in short-term and long-term memory, elevated blood pressure, elevated hunger, reduced balance and coordination, reduced sex drive, and suppression of the immune system.  Many of these issues are related to altered brain functioning.  After 18 hours of being awake, the average person functions as badly driving a car as someone who fails a blood-alcohol test.  Some of the effects of sleep deprivation are also illustrated in the “Wikipedia Man” of figure 1.

While most people recover from a single sleepless night without lasting effects, the effects of chronic partial deprivation are more insidious.  People who chronically sleep less than they should are more likely to have health problems as well as a shorter life span.   Although there is variation in how much sleep is needed, the “sweet spot” is typically between 7 to 8 ½ hours of sleep per night.  It is very worrying to health professionals that as much as 30% of the U.S. population get chronically insufficient sleep. Regardless of cause, chronic sleep deprivation/disruption is clearly bad for your health.   Paradoxically, sleeping longer than normal is even more strongly associated with impaired health and shortened life span.

To help insure enough sleep, a “sleep drive” is biologically programmed into our brains.  Just as your brain makes you hungry when deprived of food and thirsty when deprived of water, your brain makes you sleepy when deprived of sleep.  Our brain “understands” that being chronically sleepy is not healthy and does its best to minimize this state.  In addition to making you want to go to sleep, your sleepy brain also wants you to make up for lost sleep by sleeping more at your next opportunity.  There is some evidence that the two most important types of sleep, REM sleep and slow-wave sleep (NREM3), may have separate drives.  As will be described in the next post, REM and NREM sleep appear to benefit the brain in different ways.

Unfortunately, a significant percentage of individuals “disregard” their brain’s “wisdom” on a regular basis.

SLEEP DEPRIVATION RESEARCH.

The best way to identify sleep’s contributions to brain functioning is to deprive individuals of sleep.  However, all the different methods have limitations.   The most scientifically rigorous are human and animal experiments comparing subjects randomly assigned to sleep-deprivation conditions with those in non-deprived control conditions.  However, Human Research Ethics Committees, who pre-approve the research, limit these durations for ethical reasons.   Consequently these durations may not be sufficient to see all the consequences of extended sleep deprivation.  Institutional Animal Care and Use Committees can approve longer sleep-deprivation durations for animals.  However, unlike humans, the animals are not willing participants and the methods of keeping them awake are likely stressful.  Consequently it is not always clear whether the effects are due to lack of sleep or stress.  In addition, animal brains don’t always function the same way as human brains, so animal research may not always be relevant to humans (or even to other animal species).  Another approach is to examine the case histories of humans who, on their own, have chosen to stay awake much longer than allowed in experimental research.  However,  these case histories occur under uncontrolled conditions, making their rigor and generalizability questionable.  And finally, correlational studies find that humans who chronically sleep too little (or too much) have more health problems and reduced longevity.  However, correlational studies cannot reliably disentangle cause and effect.   

Despite these issues, all lines of research point in the same direction.  Lack of sleep is bad for brain functioning!

Experimental Studies of Human Sleep Deprivation.

Aloha & Polo-Kantola (2007) and Medic et al. (2017) reviewed the effects of sleep deprivation and disruption on cognitive and noncognitive performance in humans.   Although different studies sometimes differ in particular findings, as a whole, they overwhelmingly supported sleep’s role in supporting brain functioning. 

Much of this research focuses on decrements in cognitive performance following sleep deprivation and its relationship to other aspects of brain functioning such as attention, short-term memory, long-term memory, mood, visuomotor performance, reasoning, vigilance, emotional reactivity, decision making, risk-taking, judgement, and motivation.  In addition, sleep deprivation also adversely affects non-cognitive brain functions including increased responsiveness to stress, increased pain sensitivity, increased blood pressure, increased activity of the sympathetic nervous system, increased appetite, and disturbances in circadian rhythms.  

Both reviewers point out that sleep-deprivation experiments can sometimes be difficult to interpret because they can be affected by so many variables.  For example, some studies find that cognitive performance in sleep-deprived individuals declines only because of inattentiveness but remains normal when attentive. However, other studies find that cognitive abilities are impaired even when attentive.   These differences could be due to the nature of the cognitive task and/or the extent of the sleep deprivation.  Two other cognitive performance parameters are speed and accuracy. If the task is self-paced, some sleep-deprived individuals trade speed for accuracy.  In this case, accuracy is unaffected, the subject just takes longer.  However, the extent to which subjects employ this trade-off is affected by age, sex, as well as by individual differences.  If the cognitive task is time-constrained, both speed and accuracy are likely to be affected.  There are also many other methodological issues that must be taken into consideration in designing and interpreting sleep-deprivation experiments.

Medic (2017) points out that the inattentiveness of sleep-deprived individuals can often be explained by microsleeps lasting only a few seconds. The non-responsive individual often has a vacant stare and may have a slight head movement before returning to full awareness. Although their eyes are open, and the subjects believe they are awake, their EEG is that of NREM sleep.  Microsleeps can also occur in non-deprived individuals, particularly during lengthy, boring tasks.  Many automobile and industrial accidents, particularly late at night, are now thought to be caused by microsleeps.

Another important point is that much of the research on humans has examined acute total deprivation.  Experiments examining chronic partial deprivation, the type of greatest concern to health professionals, are less common because these experiments take longer and are more difficult and costly to perform.   The two types of sleep deprivation do have similar outcomes, but there are some differences.   Two important differences are that chronically deprived individuals are generally less aware they are impaired and recover from sleep deprivation more slowly.

Experimental Studies of Animal Sleep Deprivation.

Unlike humans, non-human animals will not voluntarily stay awake for sleep researchers.  So some procedure must be used to keep them awake.  In some of the earliest sleep-deprivation experiments in the 1800’s, dogs were kept awake by walking them whenever they attempted to go to sleep (Bentivoglio & Grassi-Zucconi, 1997). In these studies, puppies died within several days, while adults lasted between 9-17 days.  Autopsies revealed degenerative changes in both the brain and body.  Although consistent with sleep being essential for biological functioning, it is not clear whether the dogs died from from lack of sleep, exercise, or the stress involved in keeping them awake.

When modern sleep research began in the 1960’s, scientists realized that they needed to find ways to keep animals awake without over-stressing or over-exercising them (Nollet, Wisden & Franks, 2020).  Much of this research utilized rats or mice where stress could now be assessed by measuring blood concentrations of corticosterone, the main stress hormone of rodents.  Some experimenters were also able to use modern brain-wave (EEG) techniques to more precisely target their procedures.  Despite improved methods, issues of interpretation remain.

Figure 2. Disk-over-water method of sleep deprivation

Perhaps the most cited example of this line of research was performed by Rechtshaffen and his colleagues using rats (summarized in Rechtshchaffen and Bergmann, 2002).  Their method of keeping subjects awake is called the disk-over-water method. As seen in Figure 2, each experimental subject had a yoked control kept under virtually identical environmental conditions.  The subject and control rats were housed in identical chambers, perched on a circular platform that extended into each of their chambers.  Both had unlimited access to food and water and in both cases the platform was just above a pan of water.

Whenever the subject of the experiment was awake the platform was stationary, however, when the subject attempted to go to sleep, the platform began rotating.   When rotating, both the subject and yoked control needed to begin walking to keep from falling into the water.  While this procedure kept subjects continuously awake, the yoked controls could sleep whenever the platform was not moving.  In some experiments the subject was totally sleep deprived, while in other experiments, the subject was deprived only of REM sleep.

The subjects subjected to either total deprivation or REM deprivation were much more seriously impaired than their yoked controls.  The deprived subjects progressively lost weight despite eating more food than their yoked controls and developed a disheveled appearance accompanied by ulcerative lesions on their tails and paws.  Both types of deprivation affected core body temperature.   The totally deprived subjects exhibited an initial rise in core temperature for a number of days followed by a decline as the experiment progressed.  The REM-deprived rats showed only the later decline.

When sleep deprivation was allowed to continue, the totally deprived rats died in about 2-3 weeks, while the REM-sleep deprived rats died in about 4-6 weeks!  Rechtshaffen and colleagues felt these effects were from lack of sleep and discounted the role of stress or a weakening of circadian rhythms for a number of reasons.  They further argued that the impaired health and death of their subjects were caused by unsustainably high energy demands for some vital process they were unsuccessful in identifying.

Other methods have also been used to deprive animals of sleep. Animals have been kept in running wheels and treadmills that begin rotating or moving when the animal shows signs of sleeping.  Another procedure involves two adjacent platforms that move above and below water in an alternating fashion.  The animal must continuously move from one platform to the other to stay out of the water.  Another procedure is to have a sweeping bar above the floor of the cage that continuously moves back and forth providing  tactile stimulation to keep the animal awake.  Another process is referred to as “gentle handling” where an experimenter keeps the animal awake by handling it when it tries to go to sleep.  Gently tapping or shaking the cage as well as mild noises have also been used.  Another approach was to introduce novel objects into the cage when the animal shows signs of sleepiness.  Many of these studies find adverse effects in sleep-deprived animals on physiology and behavior.

Figure 3: The inverted flower pot method for preventing REM sleep.

In addition to the disk-over-water method for selectively suppressing REM sleep, the inverted flower pot method has also been used for this purpose with cats and rodents.  As seen in figure 3, the mouse is perched on a very small inverted flower pot in a pool of water.  The animals is able to stay out of the water while awake and also during NREM sleep.  However, when entering REM sleep and losing muscle tone, the animal falls in the water which wakes it up.  The animal climbs back on the flower pot and the process repeats.  This obviously stressful method permits some NREM sleep, but eliminates REM sleep.

Many of these sleep-deprivation studies of animals find dysfunctions overlapping those described earlier for humans. However, Wisden, and Franks (2020) suggest that all of these methods of keeping animals awake are likely stressful to some degree.  In some experiments this conclusion is supported by an increase in blood levels of the stress hormone, corticosterone, however, in others no rise is observed.  However, Wisden and Franks (2020) point out that measuring corticosterone may not always be a good measure of stress.  If the measurement occurs at the end of the study, as was the case in many studies, initial high levels may have returned to baseline.  Corticosterone levels can also be influenced by time of day as well as the conditions under which the corticosterone is taken.

Some scientists have a name for keeping humans chronically awake against their will.  It’s called torture!  For future research, Nollet, Wisden and Franks (2020) suggest that animal research would be more relevant to human research if the animal determines whether it stays awake rather than having wakefulness imposed by an external stressful manipulation.

Given that the parts of the brain controlling sleep have now been extensively mapped, Nollet et al. (2020) suggest it may be possible to get an animals to “choose” to stay awake by manipulating their wake-promoting or sleep-promoting brain circuitry.  Nollet et al (2020) suggest this might be accomplished by either optogenetics or chemogenetics, two relatively new scientific procedures.  Optogenetics uses light-sensitive channels and pumps in the neuron membrane whose genes are virally introduced into neurons.  The neurons’ electrical activity can then be manipulated by a light-emitting probe surgically implanted in the appropriate brain location.  While chemogenetics similarly uses genetically engineered receptors, it uses drugs specific for those receptors, to affect the activity of specific neurons.  These procedures would presumably reduce the stress of keeping the animals awake compared to traditional procedures.  However, Nollet et al (2020) point out that both of these methods are expensive and present both technical and interpretational challenges.

Case Histories of Human Sleep Deprivation.

As mentioned earlier, there are people who, on their own, have stayed awake much longer than would be allowed in a scientific experiment.  Some interesting examples are individuals trying to break the world record for staying awake.  One well-known case is that of Peter Tripp, a New York City Disc Jockey, who, in 1959, stayed awake for 8.8 days as part of publicity stunt to raise money for the March of Dimes.  He remained in a glass booth in Times Square the full time, periodically playing records and bantering to his radio audience.  In 1964, Tripp’s record was surpassed by an 18-year-old Randy Gardner, as part of a high-school science project.  Gardner’s attempt was observed by both a Navy physician and a well-known sleep researcher.  Gardner managed to stay awake for 11.0 days.

After Gardner set his record, the Guinness Book of World Records discontinued awarding world records for staying awake.  They were no doubt influenced by the increasing awareness of the health risks and perhaps by liability considerations.  So…Gardner remains the “official” world record holder.  However, other individuals have since “unofficially” broken Gardner’s record.   Maureen Weston, in 1977,  stayed awake for 18.7 days as part of a rocking chair marathon in England, and Tony Wright, an Australian, stayed awake for 18.9 days in 2007.

So what happened to these people during their attempts?  Over the first couple of days, they became very sleepy and had some perceptual, motor, and cognitive issues but remained reasonably functional.  However, each had to find ways to stay awake.  Tripp had coworkers and a physician to engage and prod him if he started to doze off and over the last 3 days took stimulant drugs to help stay awake.  Gardner played basketball during the day and pinball at night.  Gardner used no stimulant drugs or coffee, although he did drink soda.  Weston rocked in her rocking chair, and Wright thought he was helped by his complex diet of raw foods.

However, after a few days, all began showing more obvious impairments that worsened as deprivation progressed.  The impairments included mood swings, difficulty communicating, memory problems, concentration lapses, blurred vision, difficulties in motor coordination, paranoia, and hallucinations.  Among the worst affected was Peter Tripp.  By the 4th day he was hallucinating about spiders crawling in his shoes, spider webs in his booth, and mice crawling around his feet.  Tripp also began experiencing paranoid delusions that his coworkers and physician were trying to sabotage his effort and by the end of his attempt appeared to suffer a nervous breakdown.  However his 3-day use of stimulant drugs could also have contributed to his schizophrenia-like symptoms.

So what conclusions can we draw?  In all cases, deprivation was associated with psychological, sensory, and motor deficits.  At the same time, it’s also clear that some level of functioning remained.   In fact, on his last night, Gardner was able to beat Dr. Dement, the sleep researcher who studied him, at 100 straight games of pinball, and then the following day gave a press conference in which he appeared remarkably cogent.  (However beating Dement at pinball may say more about Dement’s pinball skills than Gardner’s motor coordination.) When finally able to sleep, all individuals slept more than normal for a night or two, but did not need to make up all their lost sleep before returning to normal sleeping patterns and functioning.

Whether these attempts had lasting consequences isn’t clear.  By some accounts, Tripp was never the same after his experience.  He continued to suffer occasional “psychological” issues, lost his NY City job after being convicted of accepting graft, divorced his wife, and bounced around in various disk jockey jobs in California and Ohio.  Gardner did develop insomnia later in life but whether that was related to his attempt is unclear.   It is possible that some individuals, predisposed to certain problems, might be more affected by extended sleep deprivation than others.

It should be noted that all of these individuals almost certainly experienced undetected microsleeps (most of these attempts occurred before knowledge of microsleeps was widely known).  Microsleeps are more common in humans than in other animals.  Microsleeps have also been suggested to have protected these individuals from the more extreme health outcomes seen in animal research.

Correlational Studies of Chronic Sleep Deprivation in Humans.

Liew and Aung (2020) reviewed 135 publications studying the relationship of sleep deprivation/disruption to the occurrence of various types of health problems.  Many factors contributed, including shift work, stress, parental responsibilities, drug and electronic device use, aging,  insomnia, restless leg syndrome, and sleep apnea.  Regardless of cause, sleep deprivation/disruption was associated with an increased risk for dysfunctions in virtually every organ system of the body.  Sleep deprivation was particularly problematic for children and adolescents still in the process of developing.

Medic et al (2017) reviewed 97 published papers examining both short-term and long-term consequences of sleep disruption.  The consequences included enhanced stress responses,  circadian rhythm disruptions, insulin sensitivity disruptions, enhanced oxygen uptake, enhanced activation of the immune system, and decreased melatonin secretion.   Some of the initial physiological responses might be seen as adaptive attempts to cope with the sleep deprivation. However, as with many things in life, while a little is good, a lot is not better!

And of course, the worst outcome of bad health is premature death.  Cappuccio et al. (2010) performed a meta-analysis of 16 longitudinal studies of the relationship between average sleep duration and longevity.  These studies lasted between 4 and 25 years.  Average sleep duration was self-reported and deaths verified by death certificate.  For the purposes of the meta-analysis, the subjects were divided into 3 sleep-duration categories: normal sleepers (typically 7-8 ½  hours of sleep per night), short-sleepers (typically less than 7 hours/night, but often less than 5 hours/night), and long-sleepers (typically more than 9 hours of sleep per night).   Out of the 1,389,999 male and female subjects in these studies, 112,566 deaths occurred.

Cappuccio et al (2010) found a highly significant U-shaped relationship between sleep duration and likelihood of dying.   Short-sleepers were 12% more likely to have died than normal sleepers, while long-sleepers were 30% more likely.  The pattern was similar in males and females and the effects more obvious in studies utilizing older subjects.   These effects were also greater in Asian populations (particularly in Japan) although this was attributed to older subjects in these studies.

While this meta-analysis demonstrated a clear relationship between average sleep duration and longevity, this research, as well as research relating sleep duration to various health impairments, cannot disentangle cause and effect.  Do abnormal sleep durations impair health which leads to decreases in longevity?  Or does bad health affect sleep duration as well as the likelihood of dying?  Clearly cause and effect can operate in both directions, however this type of research does not effectively address this issue.

CONCLUDING REMARKS.

While there are a lot of unanswered questions, all the different types of sleep-deprivation evidence taken together convincingly support the importance of sleep for brain (and body) functioning.  What isn’t so clear is what is happening inside the sleeping brain that provides these benefits.  The next post presents a variety of (mostly) speculative ideas on how sleep provides benefits to brain functioning.

Meanwhile, I think I’ll go take a nap!

REFERENCES.

Alhola, P., & Polo-Kantola, P. (2007). Sleep deprivation: Impact on cognitive performance. Neuropsychiatric Disease and Treatment, 3(5), 553-567.

Bentivoglio, M., & Grassi-Zucconi, G. (1997). The pioneering experimental studies on sleep deprivation. Sleep, 20(7), 570-576. doi:10.1093/sleep/20.7.570

Cappuccio, F. P., D’Elia, L., Strazzullo, P., & Miller, M. A. (2010). Sleep duration and all-cause mortality: A systematic review and meta-analysis of prospective studies. Sleep, 33(5), 585-592. doi:10.1093/sleep/33.5.585

Liew, S. C. & Aung, T. (2021). Sleep deprivation and its association with diseases – a review. Sleep, 77, 192-204.

Medic, G., Wille, M., & Hemels, M. E. (2017). Short- and long-term health consequences of sleep disruption. Nature and Science of Sleep, 9, 151-161. doi:10.2147/NSS.S134864

Nollet, M., Wisden, W., & Franks, N. P. (2020). Sleep deprivation and stress: A reciprocal relationship. Interface Focus, 10(3), 20190092. doi:10.1098/rsfs.2019.0092

Rechtschaffen, A., & Bergmann, B. M. (2002). Sleep deprivation in the rat: An update of the 1989 paper. Sleep, 25(1), 18-24. doi:10.1093/sleep/25.1.18

https://wordpress.lehigh.edu/jgn2


Sleep IV: What Causes REM Sleep?

 INTRODUCTION.

Figure 1: A Representative hypnogram. from: RazerM at English Wikipedia showing the different stages of a night’s sleep.  Adults spend approximately 50-60% of their time in light sleep (NREM1 and NREM2), 10-25% in deep sleep (NREM3, also called slow wave sleep) and between 20-25% in REM sleep.

As seen in figure 1, we alternate between two different, and mutually exclusive, types of sleep: 1) Rapid Eye Movement (REM) sleep (red line) and 2) Non Rapid Eye Movement (NREM) sleep (black line, 3 stages). When we first fall asleep at night, we enter NREM sleep, the default sleep mode, accounting for around 75-80% of an adult’s sleep. However, NREM sleep is repeatedly replaced by REM sleep for short intervals (typically between 5 and 15 minutes). REM sleep accounts for around 20-25% of the night’s sleep.

The occurrence of REM sleep is controlled by a REM-Sleep Executive Center in the brainstem (hereafter referred to as the REM Center for brevity).  The way I envision this working is that NREM sleep is the primary type of sleep, with REM sleep being highly modified NREM sleep, its various modifications orchestrated by the REM Center.  

Whenever the REM Center becomes active, REM sleep abruptly appears.  In order to cause the various characteristics of REM sleep, the REM Center oversees changes in a variety of other central nervous system locations.  Other areas of the brain end REM sleep bouts by turning the REM Center off and also keeping the REM Center from turning on while awake. (Turning on while awake results in the narcoleptic sleep disorder known as cataplexy.  More about that later.)

In an adult, the switching between NREM and REM sleep results in approximately 90-min (ultradian) sleep cycles, each cycle consisting of a period of NREM sleep followed by a period of REM sleep. We normally experience around 4 or 5 of these cycles each night.    

The differences between the 2 types of sleep, as well as their mutual exclusiveness, is consistent with each serving different functions.  However in most cases the proposed functions remain speculative.  While a future post will address the functions of both types of sleep, this post lays some groundwork by examining the neuroanatomy and neurophysiology underlying REM Sleep and its “flip/flop” Control Switch.  The various characteristics are described first and the post concludes with a more detailed (but still somewhat simplified) explanation of the workings of the REM Center.

CHARACTERISTICS OF REM SLEEP.

Although carried out in various brain and spinal cord locations, all REM sleep characteristics are initiated by the brainstem REM Center.  In this section of the post, the various characteristics are described.

REM Center. 

Figure 2 shows the approximate locations of the REM Center and the characteristics it controls.  The REM Center is located in the reticular system of the dorsal pons and controls the REM sleep characteristics by sending out messages to the brain areas that cause these characteristics.

Figure 2: Some REM Sleep Characteristics.  The REM-Sleep Executive Center in the dorsal Pons sends out information to other areas of the brain and spinal cord to control the various characteristics of REM sleep.  Some of the information is sent by glutamic-acid-releasing fiber tracts (red) while other information is sent as PGO waves (orange).  LGN = lateral geniculate nucleus.

As in other posts, when describing brainstem neuroanatomy, a primitive vertebrate brain is used.  A description of the primitive vertebrate brain, as well as the rationale for its use in describing neuroanatomy is covered in a previous post.

Workings of the REM Center.

The REM Center controls other brain areas by two processes (Figure 2).  One process involves fiber tracts emerging from the ventral part of the REM Center utilizing glutamic acid (GA) as their neurotransmitter.  Ascending GA neurons connect with forebrain areas, while descending GA neurons connect with the brainstem and spinal cord.  The other process is an electrical disturbance called a PGO wave that propagates out from the REM Center to influence other brain areas.

Just to remind you, GA is the principle excitatory neurotransmitter in the brain and spinal cord, while gamma amino butyric acid (GABA) is the principle inhibitory neurotransmitter of the brain, and glycine is the principle inhibitory neurotransmitter of the spinal cord.   All the other (100+) neurotransmitters function mainly to modulate the actions of these principle neurotransmitters. 

It makes sense that GA neurons would be involved in controlling REM sleep.  These large myelinated neurons allow messages to be sent quickly, often to CNS targets at some distance.  In fact, throughout the brain, GA pathways and circuits are the primary basis for information transmission and processing.

A “flip/flop” switch mechanism (analogous to a light switch) insures that REM and NREM sleep are mutually exclusive.  This switch arises from the reciprocal inhibition between the REM Center and another nearby brainstem area that I am calling the NREM Center.  The NREM Center keeps the REM Center turned off both during NREM Sleep and during wakefulness (it should probably be called the NREM/Waking Center, but that’s too much typing!).  

When experiencing NREM sleep or wakefulness, the REM Center is kept turned off by inhibitory input from the NREM Center (and other brain areas).  However, at some point excitatory input into the REM Center overcomes this inhibition causing the REM Center to turn on,  replacing NREM sleep with REM sleep.  After some time (usually between 5 and 15 minutes), the NREM Center re-establishes control and sleep reverts to NREM sleep.  This alternation continues over the course of the night with the abrupt transitions being very different from the gradualness of falling asleep or the gradual switching between different NREM sleep stages.   More detail about all this later.

Although REM sleep is named for its rapid eye movements, other characteristics also distinguish it from NREM sleep.  These include: bodily paralysis/atonia, cortical desynchronization, hippocampus and amygdala activation, and loss of body homeostasis.

ROLE OF GLUTAMIC ACID FIBER TRACTS IN REM SLEEP.

Glutamic acid (GA) fiber tracts originating in the REM Center control bodily paralysis, atonia, cortical desynchrony and hippocampal activity.

Bodily Paralysis And Atonia (loss of muscle tone).

The Central Nervous System controls the skeletal muscles with 𝜶- and 𝜸-motoneurons.  The motoneuron cell bodies are located in the brain and spinal cord and their axons exit the CNS via cranial and spinal nerves to synapse on the skeletal muscles of the head and body.  The 𝜶-motoneurons control muscle contractions by synapsing on extrafusal muscle fibers, while the 𝜸-motoneurons control muscle tone by synapsing on intrafusal fibers.  When the REM Center is active, both types of motoneurons are deactivated, “disconnecting” these motoneurons from the muscles, producing muscular paralysis and atonia.  Some motor activity does sometimes “sneak through” resulting in sporadic facial and limb twitches

The reason it is important important to disconnect the CNS from the muscles during REM sleep is the individual is almost always dreaming.  While dreaming, the motor cortex is generating output that would allow the dreamer to carry out the movements performed in his/her dream.  The REM Center performs the important task of blocking this output and preventing sleepers from acting out their REM dreams.  Acting out one’s dreams could potentially be dangerous since the dreamer is not aware of his/her environment.

Several lines of evidence support this protective function.  For example, in cats, REM sleep paralysis can be selectively disabled (through several different procedures).  Such cats appear normal when awake and fall asleep normally, but when entering REM sleep, they get up and begin acting out their dreams without respect to their environment (referred to as oneiric behavior).  One interesting outcome is that we now know that cats dream about the typical things they do when awake: eating, drinking, meowing, purring, and hissing at, or attacking invisible objects! 🐈‍⬛

There is also a rare human sleep disorder called REM-Sleep Behavior Disorder (RBD) that parallels the oneiric behavior of cats.  This disorder occurs most often in middle-aged to elderly males, although also seen in females and at younger ages.    The episodes tend to occur in the latter part of the sleep period when REM dreams are the longest and most intense.  The individual enters sleep normally but when an episode occurs, the person appears to wake up and begins acting out their dream.  Multiple episodes per month are typical.

Since negative dream content is more common, the RBD individual may flail about, yell, and be at risk for accidentally hurting themselves or their sleeping partner.   Around 80% of affected individuals later develop Parkinson’s Disease or related disorders caused by the buildup of 𝜶-synuclein, a brain waste product.  RBD is different from sleep walking, which occurs only during NREM sleep. See a previous post for more detail on various sleep disorders.

The REM-Sleep Executive Center contributes to paralysis and atonia via 2 pathways (See Figure 3).  In one pathway the REM Center sends messages via GA-releasing neurons directly to inhibitory interneurons in the medulla and spinal cord (shown here only in the spinal cord).  The inhibitory interneurons  synapse upon, and strongly hyperpolarize (i.e. inhibit) the 𝜶- and 𝜸-motoneurons.  (Interneurons are small neurons with very short axons that influence other nearby neurons).  This hyperpolarization renders the motoneurons incapable of producing action potentials, disconnecting the brain from the skeletal muscles.  (The inhibitory interneurons of the medulla release GABA while those in the spinal cord release glycine.)

Figure 3.  The descending GA fibers of the REM Center block motor output from leaving the CNS in two redundant ways.  (1) Activating interneurons that inhibit motoneurons and (2) activating neurons in the Ventral Medulla that inhibit motoneurons.

An alternate GA pathway involves the REM Center activating inhibitory GABA neurons in the ventral medulla.  The longer axons of these neurons also synapse on, and inhibit,  𝜶- and 𝜸-motoneurons (see Figure 3).  This pathway further serves to disconnect the brain from the skeletal muscles. 

These 2 pathways represent an example of mother nature using redundancy to insure appropriate functioning in important biological processes.

Cortical EEG Desynchrony.

While passing through successively deeper stages of NREM sleep, the cortical EEG becomes increasingly synchronized (i.e. higher amplitude, lower frequency). However, during REM sleep, ascending GA fibers from the REM Center (figure 4)  cause the cortical EEG to become desynchronized (lower amplitude, higher frequency), and resemble that of a relaxed awake, or lightly asleep, person.

As described elsewhere, a desynchronized EEG reflects the cerebral cortex employing its parallel processing capabilities.  This processing involves sensory, motor and executive areas simultaneously working together to produce complicated mental processing.  During REM sleep, this processing affects the qualities of our REM dreams!  While dreaming can occur in NREM sleep, REM dreams are more complex, emotional, and intense than those of NREM sleep, reflecting the increased cortical processing.

Figure 4.  A schematic illustrating how ascending glutamic acid fibers bring about the cortical desynchrony seen in REM sleep

Figure 4 illustrates the pathway by which the REM Center causes cortical desynchrony.  Neurons of the REM Center release GA onto neurons in the Nucleus Basalis.  The activated Nucleus Basalis neurons in turn project to the cortex where they release acetylcholine.  Cortical acetylcholine elevations inhibit the cortical pacemaker neurons.  As the pacemaker neuron influence diminishes, the sensory, motor and executive parts of the cortex all begin working together, resulting in the various qualities unique to REM dreaming.

Hippocampal Theta Waves.

The hippocampus is also activated during REM sleep by the REM Center’s ascending glutamic acid fibers.  Like the adjacent cerebral cortex, the hippocampus is a “cortical” structure composed largely of grey matter (i.e neuron cell bodies).  While the cerebral cortex is composed of neocortex (6 layers of neurons), the hippocampus is composed of simpler, more primitive archicortex (only 3 or 4 layers of neurons depending upon the classification scheme).  However, like the cerebral cortex, the hippocampus can exhibit EEG brain waves.  The theta waves during REM sleep reflect increased hippocampal activity.

One of the most important hippocampal “jobs” is to help the cortex consolidate short-term memories (reverberating electrical circuits) into long-term memories (structural changes in the cortex itself).   These long-term memories are sometimes referred to as relational memories because the hippocampus helps not only in encoding these memories but also in relating (i.e “cross-indexing”) the memory to other cortical memories.  The hippocampus also both “time stamps” and “place stamps” these memories, providing knowledge of the time and place that the memory occurred.

Figure 5.  A schematic illustrating how the REM center activates the hippocampal theta rhythms seen in REM sleep.

Relating a new memory to other memories makes the memory easier to recall by providing multiple paths for retrieval.  Which makes it hard to understand why dreams are so difficult to remember.  The difficulty appears related more to dysfunctional retrieval (bad crossindexing?) than memory storage. While the hippocampus does become more active during REM sleep, perhaps it is not as fully operational as when awake and alert.

Perhaps dreams are difficult to recall because their recall does not contribute to adaptation and fitness.  As will be described in the next post, the neural processes that underlie REM sleep are thought to be functionally important.  Perhaps the dreams themselves are just epiphenomena  (i.e. going along for the ride).  I’m sure many would disagree with the idea that dreams are unimportant.  More about this in a future post.

As an aside, the memory problems of the early stages of Alzheimer’s Disease are caused mainly by the degeneration of hippocampal neurons (although cortical degeneration also contributes as the disease progresses).  Hippocampal dysfunction has also been implicated as a cause of Major Depression and likely underlies the memory problems associated with depression as well.

ROLE OF PGO WAVES IN REM SLEEP.

As mentioned, some features of REM sleep are influenced by PGO waves.  A brief explanation of PGO waves is presented first.

PGO Waves.

PGO waves are sporadic bursts of  high voltage detected by macroelectrodes surgically implanted inside the brain.  These high amplitude brain waves are caused by many nearby neurons firing their action potentials at the same time.

PGO waves were first detected in the pons, lateral geniculate nucleus, and occipital cortex of cats (giving rise to the PGO name), but can be detected in other brain areas as well.  The waves originate in the Pons and then propagate out to the other brain areas.  As PGO waves enter various brain areas, they contribute to REM-sleep responses.  The waves resemble epileptiform waves, although not intense enough to stimulate seizures.  Although PGO waves sometimes occur outside of REM sleep, they are highly symptomatic of REM sleep.  However there are species differences.  In mice and rats, for example, these waves are confined to the Pons and are called P-waves.

Bursts of PGO waves typically begin around 30 seconds before the onset of REM sleep.  After REM sleep has begun, the waves recur intermittently as bursts of 3 to 10 waves.  In between periods of activity are periods of quiescence.  This relationship led  to the idea that REM sleep is not a single state but is an alternation of two microstates: 1) a Phasic state when the PGO waves are active and 2) A Tonic state when they are not.  The brain does appear to function differently in the two states.  For example, during the Tonic state, the brain is more responsive to tactile and auditory stimulation (as measured by evoked potentials in the cortex) and the person is easier to wake up.  However the overriding purpose of having 2 microstates is not clear.

Much of what we know about PGO waves has come from studying cats.  Because the electrodes necessary to detect PGO must be surgically implanted, these waves have not been measured in healthy humans for obvious ethical reasons.  However, PGO waves have been detected in a few “unhealthy” humans (with surgically implanted electrodes for either Parkinson’s Disease or Epilepsy).  Consequently, it is safe to assume that PGO waves occur in healthy humans as well.

As the PGO waves travel to other areas of the brain, the waves influence local neural activity and functioning.  For example, rapid eye movements as well as occasional facial and limb twitching correlate with the occurrence of PGO waves.  The entry of the PGO waves into the occipital (i.e. visual) cortex likely also contributes to the strong visual component of human REM dreams.

Rapid Eye Movements.

REM sleep is named for its co-occurring rapid eye movements.   While eye movements also occur during NREM sleep, these movements are less common, much slower, and the two eyes are uncoordinated.   In the rapid eye movements of REM sleep, the two eyes move in concert.

Figure 7. Representative changes in eye fixation during saccadic eye movements when looking at another’s face (By Original file: SpooSpa. Derivative: Simon Viktória – Derivative work from File:Face of SpooSpa.jpg, CC BY-SA 2.0, https://commons.wikimedia.org/w/index.php?curid=8711778)

In fact, the rapid eye movements of REM sleep bear a strong resemblance to the highly coordinated saccadic eye movements of an awake person attending to, and scanning, some aspect of the visual field (See Figure 7).  Saccadic eye movements are designed to allow us quickly to take in and analyze important aspects of our visual attention.  They are also ballistic in the sense that once initiated, they are carried through to completion without midcourse corrections.  And once completed, both eyes continue to have the same point of fixation.

The REM Center initiates PGO waves and the eye movements are eventually carried out by 3 cranial nerves controlling the muscles attached to the eyeball.  What is not clear is the intervening neuroanatomy.  There are 2 general hypotheses about what intervenes.

The leading hypothesis is that rapid eye movements are themselves saccadic eye movements related to the visual experiences of a dream.  Motor cortex does attempt to carry out the body movements we perform in our dreams.  However, as described earlier, this output is normally prevented from leaving the CNS.  Perhaps rapid eye movements are similarly activated, but are not suppressed.  Consistent with rapid eye movements being saccadic eye movements, PGO waves are also seen when awake cats perform saccadic eye movements.

While plausible, there are issues less supportive of this hypothesis.  For example, the rapid eye movements of REM sleep  are not quite as quick nor do they continue as long as the saccadic eye movements of an awake person.  Rapid eye movements are also more likely to loop back to their starting point sooner than saccadic eye movements.  Also, in contrast to expectations, individuals blind since birth exhibit rapid eye movements during REM sleep.  And finally there are subcortical structures possessing the capability to influence eye movements independent of the cortex.

Figure 8. Two hypotheses for the neuroanatomy causing rapid eye movements (REMs)

An alternate hypothesis is that the superior colliculus (an unconscious visual processing center in the midbrain), or perhaps even the motor nuclei of the cranial nerves controlling eye movements, are the intervening structures. If so, the rapid eye movements would be correlated with dreaming but not caused by dreaming (see figure 8).

More research is certainly necessary to understand the intervening neuroanatomy.

Amygdala Gamma Waves.

The amygdala is also activated by PGO waves.   Like the hippocampus, the amygdala is part of the limbic system.   One function of the amygdala is to assign emotional value to both stimulus input and behavioral performance.  Also, like the hippocampus, the amygdala participates in the storage of cortical memories, but in this case, the storage of emotional memories.

Parts of the amygdala are composed of paleocortex (intermediate in complexity between neocortex and archicortex) and capable of exhibiting EEG brain waves.  However, in the amygdala, highly desynchronized gamma waves, time locked to PGO wave bursts, reflect amygdala activation.  The high levels of amygdala activity during REM sleep are thought to account for why REM dreams typically have a significant emotional component.

While the emotions in our dreams can be positive, negative emotions are more common.

Loss of Homeostasis.

There is also a loss of homeostasis during REM Sleep.  Homeostatic processes exist to keep internal bodily conditions within acceptable limits.  The unconscious autonomic nervous homeostatically regulates such bodily processes as breathing, heart rate, blood pressure and body temperature.  These processes occur during both wakefulness and NREM sleep.

Figure 9.  A schematic illustrating how PGO waves reduce homeostasis.

However, during REM sleep, homeostatic  processes are disrupted by PGO waves.  Breathing, heart rate, blood pressure and body temperature begin to fluctuate outside of normal limits. For example, the body is unable to respond to oxygen decreases by increased breathing rate, to decreases in external temperature by shivering, or to increases in body temperature by sweating.   The loss of homeostasis also results in the nocturnal erections of the penis and clitoris independent of sexual arousal.

It is reasonable to assume that the evolutionary benefits of REM sleep exceed its costs.  However,  the loss of homeostasis during REM sleep is clearly a cost.  Mother Nature appears to have minimized this cost by keeping REM bouts relatively short so as not to cause lasting consequences.  As might be expected, small mammals, that are more likely to struggle to regulate body temperature, have shorter REM bouts.  Also mitigating this cost, REM sleep is inhibited when sleeping in either colder or warmer temperatures than normal.

Perhaps the loss of homeostasis during REM sleep also accounts for why people prefer to sleep with a covering, even when it is not particularly cold.

NREM vs REM dreams.

If you define dreaming as mental activity during sleep, dreaming occurs in all stages of sleep.  While the REM Center does not cause dreaming, it almost certainly influences the REM dream characteristics.  As noted earlier REM and NREM dreams differ in a number of ways.  While a sleeper is almost always dreaming during REM sleep, NREM dreams are more sporadic.  The REM dreams also differ in having a more complex visual component, are more vivid, more bizarre, more emotional, and typically have a “story-line” in which the person is an active participant.  These dream characteristics are clearly influenced by cortical desynchronization, PGO wave activation of the visual cortex, and amygdala activation.

Although NREM1 dreams can have a visual component, one researcher described these dreams as more like seeing a succession of photographs whereas REM dreams are more like viewing a movie.  Perhaps  some REM dreams spill over into NREM sleep where they become somewhat altered.  There may also be differences between the different NREM stages.  Mental activity during highly synchronized NREM3 sleep appears even less complex and more closely resembles the  passive “thinking about things” when awake.  These differences in REM and NREM dreams certainly beg future research.

NEURAL CIRCUITRY CONTROLLING REM SLEEP.

Keeping the REM-Sleep Executive Center Turned Off during NREM Sleep.

The model of REM sleep presented in Figure 10 represents my understanding of how REM sleep is controlled.   The two structures of central importance are the REM Center and the NREM Center.  The REM center consists of two interconnected nuclei with rather imposing names: the sublaterodorsal nucleus, and the caudal laterodorsal tegmental nucleus. This area is also sometimes referred to as the precoeruleus region.  The NREM Center also consists of neurons from 2 regions: the ventrolateral periacqueductal grey and the lateral pontine tegmentum.  Quite honestly, I have trouble keeping these anatomical names straight.  However, it is not really necessary to remember these names to understand how the system works.  The different inputs and outputs of the REM Center are numbered in figure 10 to allow the reader to follow along with the graphics.

As pointed out earlier, the REM Center controls the characteristics of REM sleep both by GA fiber tracts (9 and 10) and by PGO waves (8).  During NREM sleep (and during wakefulness), the NREM Center inhibits the REM Center via GABA neurons (1).  The NREM Center is also “helped” by two other inhibitory inputs (2 and 3).  These 3 inputs are normally sufficient to keep the REM Center turned off during wakefulness and NREM sleep.  The “flip/flop” switch mechanism that causes the abrupt transitions between REM and NREM sleep arises from the reciprocal inhibitory interactions between the 2 centers (1, 6 & 7).  These interactions insure that when one center is “on”, the other is “off” and that switching between them is abrupt.

Figure 10.  A Schematic illustrating some of the inputs and outputs from the REM and NREM Centers that are important in regulating REM sleep and in causing the abrupt transitions between REM and NREM sleep.

To understand how this all works, you need to know that the release of norepinephrine (2) and serotonin (3) into the REM Center follow a circadian rhythm.  The greatest release of these neurotransmitters occurs when a person is awake and active, drop when awake and not active, drop even further through successively deeper stages of NREM sleep,  and reach theirFigure 10.  A Schematic illustrating some of the inputs and outputs from the REM and NREM Centers that are important in regulating REM sleep and in causing the abrupt transitions between REM and NREM sleep.lowest level during REM sleep.

During wakefulness the GABA inhibition from the NREM Center (1), coupled with that of norepinephrine (2)  and serotonin (3), keeps the REM Center turned off.  Although inhibition decreases during  NREM sleep, it is still sufficient to keep the REM Center turned off.

However, just before a REM bout, neurons in the LDP/PPT (laterodorsal tegmental/pedunculopontine tegmental) areas release acetylcholine into the REM Center (4) which overcomes the inhibition (1, 2 & 3) and the REM Center turns on.  An ascending GA fiber tract (10) brings about cortical desynchrony and hippocampal activation while a descending GA fiber tract (9) brings about body paralysis and atonia.  In addition as PGO waves propagating out of the Pons (8) activate both rapid eye movements and the amygdala, and also cause the loss of homeostasis.

When the REM Center turns on, its GA-releasing neurons abruptly turn off the NREM Center via 2 pathways.  Some GA neurons (5) activate inhibitory GABA neurons (6) that project from the REM Center to the NREM Center.  In addition, GA neurons (7) also project to the NREM Center where they activate endogenous GABA neurons that also inhibit the NREM Center.  (Yet another example of redundancy.) These two sources of inhibition (6 & 7) turn the NREM Center off.

After a variable period of time (usually between 5 and 15 minutes in humans), the NREM Center (1) along with the Locus Coeruleus (2) and the Raphe Nuclei (3) reestablish their inhibitory control and turn the REM center off.  The person then abruptly switches back to NREM sleep.

Keeping the REM Center Turned Off During Wakefulness.

Figure 11. A schematic illustrating two different pathways by which the Lateral Hypothalamus “helps” the NREM Center to keep the REM Center turned off during wakefulness.

Two other neurotransmitters, Orexin (also called Hypocretin) and Melanin Concentrating Hormone serve the important role of insuring that  the NREM Center keeps the REM Center turned off during wakefulness (see figure 11).    Both neurotransmitters are released at their highest levels during wakefulness. (Melanin Concentrating Hormone was first discovered outside the brain where it serves as a hormone, but inside the brain it serves as a neurotransmitter).

However, it is possible for the REM Center to turn on during wakefulness.  This is what happens in the narcoleptic sleep disorder known as cataplexy.   In this disorder, emotion-provoking situations precipitate a cataplectic “attack” causing the person to collapse and remain paralyzed for the duration of the attack.  Strangely, positive emotions, such as those that lead to laughing,  are more likely to precipitate attacks than negative emotions.  The person also sometimes experiences “dreaming” during the attack (called hypnopompic hallucinations) superimposed upon his/her waking consciousness.

The principle cause of cataplexy is the selective degeneration of orexin neurons.  Without orexin input, the NREM Center is less able to suppress the REM Center, resulting in a cataplectic attack.  Exactly why orexin neurons degenerate is not known, but cataplexy often runs in families reflecting a genetic predisposition.

CONCLUDING REMARKS.

When mother nature “figures out” a good way of accomplishing an outcome that benefits survival and fitness, that trait does not change much over evolutionary time.  In some ways REM sleep fits this category.  For example REM sleep occurs not only in terrestrial mammals, but features of REM sleep are seen in birds, reptiles and even some aquatic invertebrates such as cuttlefish (Peever and Fuller, 2017).  Even some insects and spiders are thought to show features of REM sleep.

At the same time, substantial variation exists in REM sleep, even among mammals.  As pointed out earlier “PGO waves” do not propagate out of the Pons in rats and mice as they do in cats and humans. Aquatic mammals like whales and porpoises apparently don’t engage in REM sleep at all while Northern Fur Seals engage in REM sleep only when sleeping on land.  Perhaps in aquatic environments, where body heat can be lost quickly, the loss of homeostasis during REM sleep is too severe a “cost.”  However, platypuses, another aquatic mammal, appear to have “solved” this problem by combining REM and NREM sleep into a single type of sleep.  Despite these mammalian differences, the underlying neuroanatomy in different mammals is remarkably similar (Peever and Fuller, 2017) indicating that  the REM neural circuitry itself is highly conserved!

The next post will examine the functions of sleep in general as well as those of REM and NREM sleep.

REFERENCES.

These references go into deeper detail on the neuroanatomy and descriptions of REM Sleep.

Corsi-Cabrera, M., Velasco, F., Del Rio-Portilla, Y., Armony, J. L., Trejo-Martinez, D., Guevara, M. A., & Velasco, A. L. (2016). Human amygdala activation during rapid eye movements of rapid eye movement sleep: An intracranial study. Journal of Sleep Research, 25(5), 576-582. doi:10.1111/jsr.12415 [doi]

Peever, J., & Fuller, P. M. (2017). The biology of REM sleep. Current Biology : CB, 27(22), R1237-R1248. doi:S0960-9822(17)31329-5 [pii]

Simor, P., van der Wijk, G., Nobili, L., & Peigneux, P. (2020). The microstructure of REM sleep: Why phasic and tonic? Sleep Medicine Reviews, 52, 101305. doi:S1087-0792(20)30048-4 [pii]

Wang, Y. Q., Liu, W. Y., Li, L., Qu, W. M., & Huang, Z. L. (2021). Neural circuitry underlying REM sleep: A review of the literature and current concepts. Progress in Neurobiology, 204, 102106. doi:S0301-0082(21)00120-9 [pii]


https://wordpress.lehigh.edu/jgn2


Sleep III. The Neuroscience of Sleepiness.

Introduction.

Sleepiness is a powerful force compelling us to go to sleep each night.  While sleepiness can be resisted for extended periods,  it always wins out in the end.  The negative consequences are just too negative.   In fact, in animal research, extreme sleep deprivation has sometimes proven fatal.

According to the Guinness Book of World Records, the official human record for staying awake of 11 days and 25 minutes was set in 1964 by a then 17-year-old Randy Gardner.   In addition to becoming incredibly sleepy, Gardner experienced sensory, emotional, and cognitive deficits as his sleep deprivation progressed.  Fortunately, he suffered no lasting effects.  However, after granting Gardner the world record, the Guinness Book of World Records decided, for ethical (and probably legal) reasons, to no longer consider world records for staying awake.  While Gardner’s record has since been “unofficially” broken, such attempts are discouraged by sleep experts!

This post will examine the neural processes that cause us to become sleepy.  However, these processes all work by inhibiting wakefulness, the default state.  So, in order to understand the causes of sleepiness,  you must first understand the causes of wakefulness.

Brainstem Mechanisms Promoting Wakefulness.

Both sleepiness and wakefulness arise from the functioning of the cerebral cortex.  At the same time, the cortex’s management of these  states of consciousness is guided by the brainstem.  The most important brainstem structures are located in the reticular system, a diffuse, polysynaptic pathway running up the center of the brain.  At one time the reticular system was thought to be an alternative sensory system because it receives input from all the different senses, including vision, taste, smell, touch, temperature, etc.  However we now know its “job” is not to process the nature of this sensory input, but rather to act as an “early warning system” to keep the cortex awake and alert when important sensory information needs to be acted upon.

Three different reticular activating system structures contribute to wakefulness including the Medial Pontine Reticular Formation, the Locus Coeruleus, and the anterior Raphé Nuclei.   All become active under similar circumstances and produce different, but complementary, effects.  A fourth area, just anterior to the Reticular Activating system, the Tuberomammillary Nucleus of the hypothalamus, also contributes.

All 4 structures affect wakefulness and arousal through the release of specific neurotransmitters into the cortex.  For all these neurotransmitters, release is highest when awake and behaviorally active, lower when awake and nonactive, even lower during NREM sleep, and except for acetylcholine, lowest during REM sleep.  Thus the effects of these neurotransmitters are greatest when the need for wakefulness is highest.

In my teaching I found it was often easier for students to understand brainstem neuroanatomy when displayed on a simpler primitive vertebrate brain than on a human brain (with its twists and turns).  So that is what I do here.  A more  detailed description of primitive vertebrate neuroanatomy and its relationship to human neuroanatomy can be found in another post.

Medial Pontine Reticular Formation.

The neurons of the Medial Pontine Reticular Formation originate in the middle of the pons and use acetylcholine as their neurotransmitter.  However, rather than  projecting directly to the cortex, their input is relayed by 2 intervening structures.  In one pathway the Nucleus Basalis serves as a relay, and in the other pathway, 2 thalamic nuclei (the medial and intralaminar nuclei) serve as a relays (See Figure 2). However, the “relay” neurons  also release acetylcholine as their neurotransmitter.  Presumably if one pathway fails, the other can take over and insure that this important process is carried out.

Figure 1. A schematic showing the pathways by which the projections of the Median Pontine Reticular Formation alerts the cortex to cognitively process important sensory input.

Acetylcholine exerts its arousing effects by inhibiting a type of cortical neuron known as a “pacemaker” neuron.  While pacemaker neurons represent only a small fraction of all cortical neurons, they have the unusual ability to synchronize the action potentials of the many hundreds of other neurons in their vicinity.  The pacemaker neurons are most influential during the deepest stages of NREM sleep, when acetylcholine input is very low.  At this time, the pacemaker neurons cause the cortex to exhibit the high-amplitude, low-frequency EEG characteristic of sleep.  This role was described in detail in a previous post.

Upon awakening in the morning, acetylcholine release begins inhibiting the pacemaker neurons which, in turn, causes the cortical EEG to become more desynchronized, exhibiting a lower amplitude and higher frequency.  Throughout the day, whenever the person encounters a challenging situation, acetylcholine release further enhances cortical desynchronization. Even mild challenges such as deciding whether to have pancakes or oatmeal for breakfast cause some increase.  (That’s actually a difficult challenge for me!)  The more challenging the “problem,” the more activated the reticular formation, and the more desynchronized the cortex.

When awake, cortical desynchronization enhances the cortex’s ability  to engage in cognitive processing, allowing the person to better solve the day’s problems.  (The reason why cortical desynchronization enhances cognitive processing is explained in an earlier post).  Conversely, should the effects of acetylcholine be prevented, cognitive ability would be diminished.  Two drugs that do just that are scopalamine and atropine.  Both are acetylcholine-receptor blockers and can produce cognitive and memory deficits that mimic Alzheimer’s Disease.  Fortunately the drug effects are only temporary!  On the other hand, the permanent symptoms of Alzheimer’s Disease are caused by the death of acetylcholine-releasing neurons in the Nucleus Basalis (as well acetylcholine neurons in the lateral septum and diagonal band of Broca that target the hippocampus).  As Alzheimer’s disease progresses, other types of cortical neurons die as well.

In summary, acetylcholine release into the waking cortex causes the cortical desynchrony that both promotes wakefulness and allows us to use our cognitive abilities to their fullest.

Anterior Locus Coeruleus.

A second reticular activating system structure promoting a different aspect of wakefulness is the Anterior Locus Coeruleus of the dorsal pons (See Figure 3).  The Anterior Locus Coeruleus does so by releasing norepinephrine into the cortex via a fiber tract called the dorsal noradrenergic bundle (also called the dorsal tegmental bundle).  (Other parts of the Locus Coeruleus innervate other areas of the brain and spinal cord.)

Norepinephrine is the neurotransmitter of the sympathetic branch of the autonomic nervous system whose role is to prepare vertebrates to deal with emotion-provoking situations (which in the extreme are referred to as “fight or flight” situations).  The degree of release is proportional to the intensity of emotion experienced.


Figure 2. A schematic showing the pathway by which the norepinephrine projections of the Locus Coeruleus cause the Cortex to attend to stimulus input in emotion-provoking situations.

Norepinephrine release into the cortex causes a state of vigilance (i.e. extreme attentiveness to sensory input). Vigilance is very adaptive in emotion-provoking situations because it makes you very alert and causes you to pay careful attention to everything going on around you.  Norepinephrine elevations also diminish other motivations, such as hunger and pain, that might divert you from the important issues at hand.

Although cocaine and amphetamine are used recreationally mainly for their rewarding effects (caused by dopamine elevations), their stimulant effects depend upon norepinephrine elevations.  For example, amphetamine’s ability to elevate brain norepinephrine underlies its (mostly illegal) uses as an appetite suppressant (diet pills), as an all-nighter study aid for college students, and as a driving aid for long-haul truck drivers.  My father was a P38 fighter pilot in World War II and he told me that he used to take some little pills before his missions.  He didn’t know what they were, but it’s pretty easy to guess!

During sympathetic arousal, many body organs outside the brain also receive enhanced norepinephrine neurotransmitter input from sympathetic motor neurons to further insure adaptive responses to emotional situations.  These elevations  increase muscle tone, heart rate, and blood pressure, while also optimizing energy release from both fat and carbohydrate stores.  These peripheral neurotransmitter effects are further enhanced by the adrenal medulla, which simultaneously releases norepinephrine (and epinephrine) into the blood stream adding to the effects of sympathetic neuron release.  Consequently, outside the brain, norepinephrine is both the neurotransmitter, and the hormone, of sympathetic arousal.

Anterior Raphe Nuclei.

The Raphé Nuclei are a series of 8 reticular system nuclei that are the primary source of the brain neurotransmitter, serotonin.  The more anterior nuclei service the cortex while the remaining service the rest of the brain and the spinal cord (See Figure 4).  Virtually all areas of the brain and spinal cord receive input.  Like the two previous arousal centers, the Raphé nuclei are most active when awake and physically active.

Figure 3. A schematic showing the pathways by which the projection of the the Raphe Nuclei to the cortex promote a positive mood to facilitate responding appropriately to sensory input.

The Raphé Nuclei make several contributions to our consciousness through serotonin elevations in the cortex. For normal individuals, naturally occurring serotonin elevations help provide the mental energy and mindset that promotes adaptive responses to the challenges of the day.  In contrast, abnormally low levels of serotonin are associated with depression.   In addition to feeling sad, depressed individuals often suffer from high levels of anxiety, low energy levels, slowness of movement, chronic fatigue, and a sense of hopelessness.  As a result depressed individuals often don’t respond appropriately to the day’s challenges.  By boosting brain serotonin levels, the first-line antidepressant drugs (selective serotonin reuptake inhibitors (SSRIs)) restore more normal behavior in depressed individuals.  Although far from perfect, SSRI’s do allow more normal functioning in many (but not all) depressed patients.

However, another contribution may also be important.  Just before muscle movements occur, serotonin neurons show micro bursts of serotonin release throughout the brain and spinal cord.  This led to the idea that one of their roles may be to help the central nervous system to carry out movement.  If true, this would also enhance our ability to respond behaviorally to the normal challenges of the day.  Reduced serotonin secretion in depressed individuals may also contribute to their movement deficiencies.

Tuberomammillary Nucleus.

Neurons of the Tuberomammillary Nucleus, located just anterior to the reticular activating system, in the posterior portion of the hypothalamus, are the primary source of the neurotransmitter, histamine.  A fiber tract from the Tuberomammillary Nucleus connects directly with the cortex where histamine release produces wakefulness and arousal in a fashion similar to acetylcholine (see Figure 5).  As with the other neurotransmitters of arousal, histamine is released mainly when the brain needs to be alert and cognitively active.

Figure 4. A schematic showing the pathways by which the Tuberomammillary Nucleus promotes arousal with directly by histamine release and indirectly  by acetylcholine release.

As expected, blocking the effects of cortical histamine produces sleepiness.  Antihistamines are drugs taken by cold and allergy sufferers to reduce nasal congestion.  These drugs provide relief by blocking histamine receptors in the nasal cavity.  The newer generation antihistamines can not cross the blood brain barrier and thus do not affect the histamine receptors in  the brain.  However the older generation antihistamines do cross the blood brain barrier and, as predicted, their principal side effect is drowsiness.  In fact, these older generation antihistamines are now recommended for use only at night and are also sold as over-the-counter sleeping aids.

The Tuberomammillary Nucleus also releases histamine into the Nucleus Basalis causing the Nucleus Basalis to release acetylcholine into the cortex.  Thus in addition to arousing the cortex directly through histamine release, the Tuberomammillary Nucleus also arouses the cortex indirectly through promoting acetylcholine release (See figure 5).

In summary, all 4 brainstem inputs into the cortex promote alertness and enhance cognitive functioning in a complementary fashion and optimize adaptive responses to important sensory input.

Neural Mechanisms Promoting Sleep Onset. 

The previously described neurotransmitter inputs into the cortex cause wakefulness and arousal to be the default cortical state.  Sleepiness arises from the inhibition of these arousal mechanisms.  Three processes known to inhibit the brainstem arousal systems are 1) the circadian buildup of adenosine in the extracellular fluid of the brain, 2) Increased activity in the Nucleus of the Solitary Tract, and 3) Increased activity in the Median Preoptic Nucleus.

Adenosine Buildup In the Extracellular Fluid.

Perhaps the most important factor normally causing the evening’s sleepiness is the buildup, over the course of the day, of a metabolic waste product called adenosine.  When you wake up in the morning, brain adenosine levels are low and then gradually increase over the course of the day.  This buildup promotes sleepiness.  However, once asleep, the brain “disposes” of this waste product and the cycle repeats itself the next day.

In addition to being a waste product, adenosine is also an inhibitory neurotransmitter utilized by a small fraction of the brain’s neurons.  (Reminds me of a funny SNL skit many years ago where a salesman was selling a product that was both a mouthwash and a floor polish).  So it is not surprising that some of the brain’s neurons have adenosine receptors.  However adenosine receptors can be bound not only by adenosine, the neurotransmitter, but also by adenosine, the waste product.  It just so happens that the acetylcholine neurons of the Thalamus and Nucleus Basalis are rich in adenosine receptors.  Over the day, extracellular adenosine increasingly binds these receptors, inhibiting acetylcholine release into the cortex, and by the end of the day, promoting cortical synchrony and sleepiness.

Figure 5. A schematic showing the pathways by which the daily buildup of adenosine in the extracellular fluid of the brain promotes sleepiness by inhibiting acetylcholine release into the cortex.

So…where does the waste adenosine come from?  Adenosine is a metabolic breakdown product of two common and very important molecules.  The first is adenosine triphosphate (ATP), which the mitochondria use as the energy source to drive intracellular metabolism.  The other source is cyclic adenosine monophosphate (cAMP),  a very common intracellular messenger.  Both of these molecules are critically important to neuronal functioning and have the highest rate of use and breakdown during the day when metabolism is highest.  As a consequence, the extracellular adenosine progressively builds up in the brain’s extracellular fluid over the course of the day, binding more and more adenosine receptors, and eventually causing sleepiness.

However, in addition to serving as a neurotransmitter and a waste product, adenosine also is an important precursor for synthesizing ATP and cAMP.  At night, particularly during NREM sleep when brain metabolism drops, the brain is able to recycle, or dispose of, much of the extracellular adenosine, allowing the cycle to begin again the next day.

This explanation also helps to understand the effects of my favorite drug that I use every morning!  Because caffeine is an adenosine receptor blocker, it keeps you awake and alert and able to write neuroscience posts.  Caffeine also mildly elevates dopamine in the brain’s reward circuitry, adding to its desirable effects.

Nucleus of the Solitary Tract.

Another important sleep center is the Nucleus of the Solitary Tract (NST).  (I’m not sure where neuroscientists get these strange names.)  As seen in figure 6, the NST facilitates sleep onset by inhibiting the Medial Pontine Reticular Formation.  This inhibition reduces acetylcholine input into the cortex, which desynchronizes the cortex, promoting sleep.

Figure 6. A schematic showing the pathways by which the Nucleus of the Solitary Tract is influenced by the Vagus Nerve to promote sleepiness by inhibiting acetylcholine release into the cortex.

The Nucleus of the Solitary Tract is in turn heavily influenced by input from an unusual cranial nerve, the Vagus Nerve (see figure 7).  Like the other 11 cranial nerves, the Vagus Nerve has both motor and sensory fibers that service parts of the head.  But unlike the other cranial nerves, the Vagus Nerve also has sensory and motor connections with many parts of the lower body.  This sensory input  allows the brain to monitor activities in the viscera (digestive system, heart, and lungs) and in the skin.  This input can, in turn, influence sleepiness.

For example, Vagus Nerve input into the NST is thought to underly the sleepiness occurring after a big meal.  In this case, a full stomach is detected by both stretch and nutrient receptors which convey this information to the brain via the Vagus Nerve.  This input activates the Nucleus of the Solitary Tract to promote sleepiness.  This sleepiness is adaptive because the resulting inactivity enhances digestion.  In fact, taking a nap after a big meal is common in some cultures.

Vagus Nerve input to the Nucleus of the Solitary Tract also explains why parents rock babies to sleep or, as I sometimes used to do, take them for a car ride.  In both cases, mechanoreceptors in the skin are stimulated by the gentle skin vibrations, which communicate this information to the brain via the vagus nerve, causing sleepiness.  Babies sleep a lot more than adults because this allows them to put their energy into growth rather than into physical activity.  While this “sleepiness reflex” is pronounced in babies, I’ve also known some adults who always fall asleep on long car rides.

Median Preoptic Nucleus.

The Median Preoptic Nucleus is part of the Preoptic Area just anterior to the hypothalamus, another brain area important in regulating sleep.  (Some neuroanatomists classify the Preoptic Area as part of the hypothalamus.)

Figure 7. A schematic showing the pathways by which the Median Preoptic Nucleus  promotes sleep by inhibiting multiple arousal mechanisms.

The initial evidence that the Median Preoptic Nucleus is a sleep center was that damage to this area causes insomnia.  We now know that the Median Preoptic Nucleus induces sleep by inhibiting the various arousal centers decreasing the release of acetylcholine, norepinephrine, and serotonin  into the cortex.  The resulting neurotransmitter decrease promotes sleepiness.

The Median Preoptic Nucleus also plays an important role in mammalian thermoregulation suggesting that this structure may be important in causing the sleepiness that results from a rise in core body temperature.  Falling asleep in my classroom in the late Spring, before the University turns on the air conditioners, is not very adaptive in terms of doing well on my exams.  However, sleeping while having a fever is definitely adaptive by helping your body better use its energy to combat whatever is causing the fever.

Falling Asleep

Each night, as the various brainstem arousal mechanisms reduce the release of acetylcholine, norepinephrine, serotonin, and histamine into the cortex, you become more and more sleepy and eventually fall asleep.   Paralleling the gradual reductions in neurotransmitter release and in changing EEG, falling asleep appears to be gradual as well.

Figure 8. Two taxonomies for measuring brain waves and sleep.  Both taxonomies are explained in detail in another post.

Just before you fall asleep at night, during Stage W (see figure 8), your cortex is exhibiting the alpha waves characteristic of relaxed wakefulness.  The first stage of sleep that you enter is NREM1 sleep.  Here the alpha waves become increasingly interspersed with theta waves.  These EEG oscillations cause you to drift back and forth between different levels of environmental awareness.  In fact, if you “awaken” someone during NREM1 sleep, around 90% will tell you, incorrectly, that they weren’t really asleep.

The next stage of sleep is NREM2.  Here theta waves have become the dominant EEG waveform.  In addition, the occurrence of two additional wave forms, sleep spindles and K complexes, help define this stage of sleep.  Sleep spindles are short bursts of beta waves and K complexes are short bursts of delta waves.  A sleep researcher, upon seeing sleep spindles and K complexes, can be almost certain that the person is now asleep.  Although more difficult to wake than in NREM1 sleep, around 40% of individuals awakened from NREM2 sleep will incorrectly tell you that they were awake and not really sleeping.

When you enter the deepest and most important NREM stage, NREM3 (also known as slow wave sleep), the brain waves have transitioned to mainly delta waves with some theta waves intermixed.  Individuals are more difficult to wake up in NREM 3.   When awoken, these individuals are often groggy and disoriented, and will almost always admit to being asleep.

The time from falling asleep to entering NREM3 sleep averages around 15 minutes.  As measured by either EEG or by difficulty in awakening the sleeper, the journey from Stage W to NREM3 is gradual.

REM Sleep

After being asleep for an hour or so, the person passes from NREM sleep into the first REM sleep bout of the night.  However, unlike the gradualness of passing through the various NREM stages, the transition from NREM to REM sleep is abrupt.

The shift back and forth between NREM sleep and REM sleep over the course of the night is thought to occur because of a “flip/flop” switch mechanism that operates almost instantaneously.  The subject of the next post will be the brainstem neuroanatomy that causes this abrupt shift from NREM to REM sleep and vice versa.

https://wordpress.lehigh.edu/jgn2


Sleep II: Frequently Asked Questions about Sleep.

Introduction.

Contrary to popular belief, you are not unconscious while you sleep.  Sleep is simply a different state of consciousness!  All states of consciousness share some common features.  All arise from the electrical activity of the cerebral cortex.   All possess some degree of awareness of the surrounding world.  And finally, all can give rise to mental activity and behavior.  The mental activity and behavior of sleep are the subjects of this post.

One of the most important discoveries of sleep research is that, over the course of the night, we oscillate back and forth between 2  different types of sleep.  Since mammals share this type of sleep with birds and perhaps some reptiles, a version of this type of sleep likely appeared long ago in an ancestor to both mammals and birds.  A future post will address the evolution and adaptive functions of these 2 types of sleep.

So what are the two types of sleep?

The two types of sleep are Rapid Eye Movement (REM) Sleep and Non-Rapid Eye Movement (NREM) sleep.  Eye movements can occur in both, although less common in NREM sleep, and more rapid during REM Sleep.   The original sleep taxonomy developed by Rechtschaffen and Kales in 1968, identified a single stage of REM sleep and 4 different stages of NREM sleep.  However, the distinction between the two deepest stages of NREM sleep (NREM3 and NREM4) did not prove very useful.  So in 2007, the American Academy of Sleep Medicine combined the older NREM3 and NREM4 stages into a single NREM 3 stage.  The newer NREM3 stage, also referred to as Slow Wave Sleep, and is now considered the deepest and most important type of NREM sleep.  The use of EEG to define the different NREM stages is detailed in another post.

Figure 1: A Representative hypnogram. from: RazerM at English Wikipedia.  NREM3 and NREM4 from the older sleep taxonomy are now combined into NREM3 in the newer taxonomy as seen in this figure.

A hypnogram showing REM sleep and the different stages of NREM sleep over a typical night is seen in Figure 1. The lightest stages of sleep (NREM1 and NREM2) are thought to be the least important and serve mainly as transitions between  the more important stages.  The functions of the most important stages, NREM3 and REM, will be covered in another post.

Over the course of the night, the two different types of sleep alternate in approximately 90-minute cycles, with a single cycle containing a bout of NREM sleep (often containing multiple NREM stages) followed by a bout of REM sleep.  In a typical night, a person experiences 3-5 cycles. REM sleep accounts for around 20-25% of a night’s sleep, NREM3 (Slow Wave Sleep, Deep Sleep) for around 10-25% and light NREM sleep (NREM1 and NREM2) for around 50-60%.

It is interesting that the 2 most important sleep stages typically occur at different times of the night.  NREM3 sleep almost always occurs during the first third to half of the night’s sleep (see Figure 1) while REM bouts are the longest and most intense toward the end of the night’s sleep.

Despite the fact that almost everyone sleeps and dreams, there are a lot of misconceptions.  This post addresses a number of questions about dreaming and other sleeping phenomena.

What is the mental activity occurring during REM sleep?

Most folks know the answer to this, it’s dreaming.  A REM dream is a vivid, highly visual, hallucinatory, often emotional, and sometimes bizarre mental event that has a storyline in which the dreamer is an active participant.  Sometimes the dream’s storyline contains elements of the person’s recent experiences.  For many years it was thought that dreaming occurs only during REM sleep, however, we now know that dreaming, or something very much like it, occurs during NREM sleep as well.

How do we know when dreaming occurs?

That’s simple.  Have someone sleep in a sleep laboratory while measuring their brain waves.  Wake them during different sleep stages and ask “were you dreaming”?  If they were experiencing REM sleep, they will say “yes” around 80-90% of the time and will describe what we think of as a dream.  In fact, estimates are that 8o% of dreaming occurs during REM sleep.

If you awaken a sleeper during NREM sleep, and ask them if they were dreaming they will say yes around 10-20% of the time. However, if you probe deeper, you find that the likelihood depends upon the stage of NREM sleep.  Reporting a dream is most likely to occur in NREM1 and least likely in NREM3.  This suggests that perhaps some NREM dreams may originate in REM sleep and spill over into adjacent NREM1 sleep.  Perhaps NREM1 is best able to support dreaming because its cortical EEG brain waves are most similar to those of REM sleep.

How do REM dreams compare to NREM dreams?

There do appear to be some differences between between REM and NREM dreams.  REM dreams are typically rated as “more intense, bizarre, vivid, visual, and kinesthetically engaging” and the sleeper’s verbal descriptions tend to be longer with more continuous storylines.  On the other hand, the description of  NREM dreams tends to be shorter, less detailed, and more disconnected.  The differences have been described as analogous to seeing a collection of photographs versus watching a movie.  Yet other NREM “dreams” are even more different, more like the non-visual, conceptual thinking when awake.

There is not complete agreement as to whether the differences between REM and NREM dreams are qualitative or quantitative.  Consequently, we are not sure whether REM and NREM dreaming are caused by the same, or different, underlying brain processes.  Certainly more research is necessary here.

How long does a REM dream last?

For REM dreams, a dream typically lasts as long as a REM bout.  REM bouts can last anywhere from a few minutes up to 20 or 30 minutes.

However a single REM dream can have different “episodes” where one episode morphs into another. For example I remember a particularly vivid dream where in one episode I was laying on a lounge chair by a swimming pool and suddenly the lounge chair changed into a Harley Davidson motorcycle and I was speeding down the highway. Where that came from, I’ll never know since I have never owned a motorcycle, much less a Harley Davidson.  Probably my inner Walter Mitty breaking through!

Although the body is mostly immobile during REM sleep, occasional small body movements are thought to correlate with the switch from one episode to the next.

How fast does time pass in a REM dream?  

Some people feel that time moves faster during a dream, allowing them to experience more in a given amount of time than when awake.

The way this has been tested is to awaken sleepers at various times after entering a REM bout and asking them “how long have you been dreaming?”   Although individual estimates may not be exactly correct, if you take the average of a large number of estimates and compare that to the average of how long they had been in REM sleep, the averages are remarkably close. So the answer is that time appears to pass at about the same speed when dreaming as when awake.

How many times do we have a REM dream each night?

We normally have as many dreams each night as we have REM bouts, which is typically around 3-5.  All other things being equal, the longer you sleep, the more you dream.  The dreams (and REM bouts) usually become longer and more intense as the night progresses.

Do some people not dream?

Some people feel that they don’t dream.  However if such a person is put in a sleep laboratory, woken during a REM bout, and asked if they were dreaming, they almost always say, “yes.”  So, most people have multiple dreams every night, it’s just that some people are better at remembering their dreams.  At the same time, there are rare neuropathologies, and some drugs (e.g. stimulants and SSRI antidepressants), that can suppress the ability to experience REM sleep and dreaming.

Why are some people better at remembering their dreams?

There are likely multiple reasons. However one reason has to do with how you awaken in the morning.  If you wake up abruptly to a shrill alarm clock during your last REM bout of the night, which often contains the most intense, vivid dream of the night, you likely will be aware of that dream.  However, if you awaken gradually, you will likely not have a memory of your last dream.

Why are REM dreams so easy to forget?

Dreams are notoriously easy to forget.  If you wake a person one minute after a REM bout has completed, the person will often have no memory of the REM dream they were just experiencing.  Even when woken in the middle of a dream, if the dream is not quickly rehearsed, the details often seem to slip away.  One possible explanation is that dreams are encoded in transient short-term memory and not readily consolidated into the longer-term memory necessary for later recall.

However, my own experience, as well as that of others, would suggest this is not the case!  Some people can remember dreams from previous nights, often just before they fall asleep. In order for dream recall to occur days later, the dream must be encoded in long-term memory. An alternative explanation is that dreams are encoded as long-term memories, but for some reason, are difficult to retrieve into conscious awareness.

A possible explanation is that poor dream recall reflects state-dependent memory recall. That is, the ability to recall a memory can sometimes be enhanced if you can recreate the conditions under which the memory was originally acquired.  In so doing, you provide yourself with more cues for memory retrieval.  In this regard, the brain waves just before you fall asleep at night are very similar to those that occur during dreaming, perhaps enhancing dream recall.  State-dependent recall also accounts for why some of my college students prepared for exams by studying the night before in the classroom in which they will later take the exam.

In fact, some psychologists study sleep and dreaming, not because they are interested in sleep and dreaming per se, but because they are interested in the workings of memory.

What are Lucid Dreams?

A lucid dream is one in which the dreamer is consciously aware they are dreaming as the dream is occurring.  Some lucid dreamers are even able to influence the content of their dream, although this is not necessary for a lucid dream to occur.  In a large survey, about half the participants reported having a lucid dream at least once in their life and about a quarter did so on a regular basis.  People who practice meditation are more likely to have lucid dreams.  While lucid dreams are rare for most individuals, there are techniques that can be employed to increase their likelihood.

There is disagreement as to whether lucid dreams are good or bad for you.  On the positive side, lucid dreamers are usually better able to remember their dreams.  To the extent that dreams involve working through the problems of the day, perhaps this is good for mental health.  And for those lucid dreamers that can control the content of their dreams, lucid dreaming presumably should result in fewer negative dreams or “nightmares.”

On the other hand, lucid dreaming is an abnormal state, mixing elements of both being asleep and awake.  Most of the awakenings over the course of the night occur during REM sleep (see figure 1).   Since the cortex is neurologically more active during lucid dreaming, this type of dreaming may result an increased probability of waking up and of less sleep over the course of the night.  Since certain types of memory consolidation are also thought to occur during REM sleep, increased episodes of waking up might also impair memory consolidation and emotional regulation.  And finally lucid dreaming is common during a sleep pathology called cataplexy.  More about that later.

What are the Rapid Eye Movements doing?

The function of rapid eye movements during dreaming is controversial.  One school of thought is that the eye movements relate to the visual experiences of the dreamer.  We often interact with others in our dreams and the eye movements of REM sleep bear some similarity to the saccadic eye movements during awake social interactions.

However, other findings are not supportive.  For example, the eye movements while dreaming are less rapid that those of awake individuals.  In addition, there is some evidence that the electrical activity giving rise to rapid eye movements (PGO waves) originates in the brainstem before spreading to the cortex.  PGO stands for “Pons-Geniculate-Occipital” reflecting that these waves can be detected in a variety of brain areas.  While PGO waves can be detected in cats and rats in the part of the motor cortex that controls eye movements, they can also be measured in other brain areas. (Measuring PGO waves deep in the brain is too invasive to perform experimentally in humans.)  Consequently it is  possible that rapid eye movements are caused by brain areas outside the cortex and only indirectly related to the dream content generated by the cortex.

So whether the eye movements are related to the experiences in our dreams or are caused by unrelated, but correlated, neural activity in the brainstem is unclear.

What does the average person dream about?

Several sleep researchers have compiled books of dreams by waking up sleepers and asking them to describe their dream. The average dream content tends to be different from what most people would guess.  Most dreams are rather mundane, occurring in environments with which the person is familiar, populated largely by people that the dreamer knows.  Family, friends, money, work, school and health issues are often involved.  Dreams often reflect the person’s concerns, with the content more likely to be negative than positive.  Being chased, falling, arguing, being unable to prevent something from happening, and forgetting to attend important life events, are common themes.  There are also sex differences, with male dreams more likely to contain aggression and negative emotions.

In contrast, if you ask a person to describe one of their past dreams, they may tell you about their wonderful experiences being marooned on a desert island with Robert Redford or Jennifer Anniston (I’m dating myself here). Although there are many more mundane than exotic dreams, people are more likely to remember the interesting ones.

What is the function of dreaming?

That is the $64,000 dollar question!  While there is much speculation, the answer is, “we don’t really know.”  A somewhat easier question, addressed in a future post, concerns the function of REM sleep.  However, even that does not have a definitive answer.

What happens when the neural mechanisms controlling sleep malfunction?

For most of us, sleep functions as it should most of the time.  However, sometimes the underlying neural mechanisms “misbehave” giving rise to parasomnias.  Parasomnias are sleep disturbances that take the form of abnormal behaviors, movements, emotions, and perceptions  during sleep. Neural malfunctions during both REM sleep and NREM sleep can give rise to parasomnias.

What happens when REM sleep malfunctions?

While experiencing a dream, primary motor cortex is attempting to send messages to your muscles that would cause you to act out the behaviors you’re performing in your dreams.  Fortunately, there is a brainstem mechanism that prevents that from happening by deactivating the 𝛼-motoneurons that would carry this message from the central nervous system out to the muscles.  With the exception of eye movements and breathing, you are almost completely paralyzed during REM sleep.  If this paralysis didn’t occur you would get up and act out your dreams.  This outcome was first confirmed a number of years ago by experimentally disabling the paralysis mechanism of cats.  By watching cats act out their dreams we know that cats dream about about “cat-like” things: eating, meowing, scratching, hissing at another cat, etc. 😀

In humans, occasionally some motor information  “sneak throughs” this protective mechanism, causing the twitching seen during REM sleep.  In fact, once or twice a year, even normal individuals may wake themselves during a bad dream by jerking an arm or leg.

REM Sleep Behavior Disorder (RBD).  However, a rare but more serious parasomnia is called REM Sleep Behavior Disorder (RBD) in which the paralysis mechanism fails, several times per month is not uncommon, resulting in the person attempting to act out their dream.   Since negative dream content is common, a sleeping person experiencing a RBD episode could start screaming, using foul language,  flailing an arm in anger, or even getting up and smashing into something.  Since they are asleep with their eyes closed, they usually don’t get very far.  However, the person can potentially hurt their sleeping partner or themselves.  On the other hand when experiencing a positive dream, the person might sit up smiling or laughing.  Most RBD episodes occur in the latter part of the night when REM dreams are typically the longest and most intense.  RBD is most common in middle-aged men although  it can occur in both sexes and at other ages.

A sleep test in a sleep laboratory is often necessary to diagnose RBD since there are other parasomnias, such as sleep walking (a NREM disorder), with overlapping symptoms.  There are steps that can be taken to minimize the likelihood of the RBD individual hurting themselves or others.  While some medications can help, there is no cure for this parasomnia.  Good sleep hygiene can help to control RBD, and is helpful for  all the other parasomnias as well.

Narcolepsy and Cataplexy.  Narcolepsy is another REM-sleep related parasomnia characterized by excessive daytime sleepiness.  There are two types: Type 1 and Type 2.  Both are relatively rare, with Type 1 being around 3 times more common than Type 2.  Neither is “curable” although their symptoms can be treated.

Type 1 narcolepsy, in addition to causing sleepiness, causes cataplexy.  During a cataplexy episode, an awake person, going about their daily activities, suddenly enters REM sleep.  When this happens, the person is instantly paralyzed and collapses like a sack of potatoes.  The fall potentially can cause injury or even death.  The episodes typically last from several seconds up to several minutes and are usually triggered by emotional arousal.  Anger, excitement, laughter, and even sexual arousal can precipitate episodes.  A cataplectic attack involves elements of both being asleep and being awake.  During the attack, the person often experiences a lucid REM dream while also retaining some awareness of their situation.  The person usually knows their “triggers” and is sometimes able to prevent, or minimize the consequences of, an attack.  A young woman filmed her own cataplexy attack on YouTube  to educate others about the disorder.

In some ways cataplexy is the opposite of RBD.  In RBD, REM-sleep paralysis doesn’t occur when it should,  while in cataplexy, it occurs when it shouldn’t.  There is considerable variability in age of onset, with the mean being around 24.  The disorder sometimes exhibits progressive onset with the initial symptoms being just excessive sleepiness before the cataplexy develops.

Type 1 Narcolepsy is most often caused by a severe deficiency in the hypothalamic neurotransmitter orexin (also called hypocretin).  The orexin-releasing neurons selectively die off although what causes them to die isn’t known.  There is an association of this disorder with a genetic allele influencing immune functioning suggesting that Type 1 Narcolepsy might have an autoimmune cause.  Type 1 Narcolepsy does run in families supporting a genetic predisposition, although environmental factors also play a role.  For example, the symptoms often first appear after an illness, such as a cold or flu.  The occurrence of Type 1 Narcolepsy in other animals, including mice and dogs,  has been useful to scientists in better understanding the disorder.

Type 2 Narcolepsy manifests as simply a low threshold for falling asleep.  The individual does not suffer from cataplexy or have a loss of orexin-releasing neurons.  It is less common than Type 1, and the symptoms generally less serious.  However, as with Type 1 narcolepsy, the excessive sleepiness can negatively affect school and job performance and can sometimes be dangerous.  For example, individuals with either type of narcolepsy are around 3 to 4 times more likely to be involved in car accidents.

For both Type 1 and Type 2 narcolepsy, the symptoms are often exacerbated by sleep deprivation.  Engaging in good sleep hygiene and taking naps during the day can be helpful.  Treatment can also involve drugs that promote wakefulness, and for Type 2 narcolepsy, drugs that inhibit REM sleep.

Sleep paralysis.  A less serious parasomnia of REM sleep escaping into wakefulness, is sleep paralysis.  This disorder happens either just before falling asleep or just after waking up, and finding that you are “paralyzed” for a period of time. Like cataplexy, sleep paralysis represents a mixed state of consciousness with elements of being both awake and asleep.  During a paralytic attack, the person often experiences a REM dream, often with negative content, superimposed on their waking consciousness.  The episodes can last from a few seconds up to as long as 20 minutes, with the average length being around 6 or 7 minutes.  Although this disorder can also occur in narcoleptic individuals, most cases are not connected.

Around 8% of the population will experience sleep paralysis at least once in their lives, but for some, it occurs on a regular basis.  However, even when occurring regularly, sleep paralysis can be only an annoyance that doesn’t adversely affect the quality of the person’s life.  I had a very good student in one of my classes who also won an NCAA national championship in wrestling who said he had this issue several times a week.  While he would rather not have the issue, he said he was not particularly affected by it.   He told me others in his family also had sleep paralysis.

However, for around 10% of sufferers, sleep paralysis is troubling enough to seek treatment.  The treatment involves following good sleep hygiene, while behavioral therapies and certain drugs can also help.

Are there any problems during NREM sleep?

There are also parasomnias that occur during NREM sleep including 1) sleep walking 2) sleep terror, and 3) confusional arousal.  These problems are most common in childhood and usually resolve by puberty, although they can occur in adulthood as well.  Often these problems are associated with issues that disrupt sleep such as sleep apnea, night-time leg cramps, and poor sleep hygiene.  Treating these other problems and promoting good sleep habits can be beneficial in controlling all parasomnias.

Sleep walking.  Sleep walking, sometimes referred to a somnambulism, occurs in around 30% of children between the ages of 2 and 13 and around 4% of adults.    Sleep walking occurs primarily early in the night’s sleep during NREM3 sleep,  The individual will get out of bed and become behaviorally active.  The behaviors could include such things as walking around, getting dressed, moving furniture, urinating in inappropriate places, and sometimes even more complex behaviors such as driving a car.  In rare cases, sleep walkers can engage in violent behaviors overlapping those of REM sleep disorder.  In this case, testing in a sleep laboratory may be necessary to distinguish these disorders.

The episodes can last from a few seconds up to 30 minutes with an average of around 10 minutes.  Often the episode ends with the person returning to bed without waking up with no memory of the episode.  If the person wakes up before returning to bed, they are very disoriented and confused, with no knowledge of how they got where they are. Because these episodes often go undetected by others, it is difficult to estimate their frequency.  There are potential dangers.  A person can hurt themselves by falling, colliding with objects in the environment, or by using dangerous objects such as knives or guns.  They can also potentially harm a sleeping partner.

For the most children, the episodes are rare, resolve on their own, and typically don’t require treatment.  However for individuals that sleep walk regularly, there are steps that can be taken to minimize harm. Locking windows and doors of the bedroom, installing motion sensors and bed alarms that are triggered when the person gets out of bed and removing potentially dangerous objects.  Sleep deprivation and stress are often associated with sleep walking, and good sleep hygiene helps in preventing episodes. Cognitive behavioral therapy can also be helpful.  Medications that promote NREM3 sleep can make the problems worse and should be discontinued.

If you encounter a sleep walker, the best strategy is to try to guide them back to their beds.  However, if you need to awaken a sleepwalker you should do so carefully as the person will be disoriented, confused, and perhaps frightened, and may have trouble getting back to sleep.

Night Terror.   Another NREM-related parasomnia is called a night terror (sometimes called a sleep terror).  As with other NREM-related disorders, night terrors are most common in children and typically resolve by puberty.  When a night terror happens, the child will often sit up in bed screaming, exhibiting signs of an intense “fight or flight” reaction, including increased heart rate, fast breathing, and covered in sweat.   However, the child does not acknowledge attempts at consolation, which can be very distressing to the parent.   After a few minutes, the child typically lays back down and sleeps normally for the rest of the night.  The next morning there will be no memory of their night terror.

A night terror is not the same thing as a “nightmare.”  A nightmare is an unpleasant REM dream typically occurring in the second half of the night’s sleep.  Night terrors, on the other hand,  occur during  the first third to half of the night in the deepest stage of NREM sleep (NREM3).  While screaming and yelling are common during night terrors, there are no vocalizations during a nightmare. Furthermore, nightmares are often remembered the next day, while night terrors are almost never remembered.  And finally while virtually all children have nightmares, night terrors are less common, occurring in less than 7% of children.

Although the cause is unknown, night terrors (as well as sleep walking and confusional arousal) are more common in close relatives, indicating a genetic predisposition. Many children may have only a single night terror in their childhood before outgrowing them. However, for some children they can occur regularly.  Parents should not wake the child during a night terror.  The child will be disoriented and confused and will most likely take longer to get back to sleep.

Like sleepwalking, the occurrence of night terrors is often associated with stress and a lack of sleep.  For example, a little over half of the children seeking treatment for night terrors also suffer from obstructive sleep apnea.  Other disorders that disrupt sleep, such as asthma, restless leg syndrome, or gastrointestinal reflux disorder, are also associated with night terrors.  Consequently, treating the associated disorders, as well as promoting good sleep hygiene and minimizing stress is often therapeutic.

Confusional Arousal.  Another disorder of NREM3 is confusional arousal.  Here the person sits up in bed and begins talking with a vacant stare, although unlike sleep walkers, they typically do not get out of bed and walk around.  What distinguishes this disorder from night terrors is the person doesn’t appear terrified and does not show sympathetic arousal.  However, their speech patterns are similar to those of an intoxicated person, being slow and halting and characterized by confusion and disorientation.  Consequently this disorder is sometimes referred to as “sleep drunkiness.”

If you try to interact, the person most often doesn’t engage.  If the person does respond, the response can sometimes be aggressive or hostile.   If not awakened, the person typically goes back to sleep and has no memory of the episode the next day.  As with other NREM3 sleep disorders, confusional arousal is most common in children.

Although considered different from sleep walking or night terrors, confusional arousal can evolve into those disorders over time suggesting that all 3 share underlying causes.  The treatments are also similar, including promoting good sleep hygiene and reducing stress.

Concluding Remarks.

Hopefully I’ve convinced you that your sleeping brain is not quiescent and that there’s a lot of stuff going on.  And sometimes these complex neural processes malfunction.  The next post will examine the neuroanatomy and neurophysiology that causes us to fall asleep each night.

https://wordpress.lehigh.edu/jgn2


Sleep I: EEG And The Scientific Study of Sleep

Introduction.

This is the first in a series of posts on sleep, a behavior we spend approximately ⅓ of our lives doing.  Since we all sleep, we can all relate to its importance.  Future posts will examine the neuroanatomy of sleep, as well as other issues related to sleep.  However, this post will describe electroencephalography (EEG), the “breakthrough” that made the scientific study of human sleep possible.

In order to scientifically study anything, you must be able to quantify it (i.e. attach numbers to it).  Until modern sleep research methods were developed, the only reliable measure was how long people slept, which wasn’t very informative for what’s going on inside the brain.  Rapid eye movements and changes in muscle tone were observed, but they seemed to occur sporadically, and could not, by themselves, provide meaningful sleep measures. 

However, the use of EEG, a safe and noninvasive procedure, changed everything!  Not only did EEG measure sleep depth, it also put the seemingly “random” eye movements and muscle-tone changes into meaningful perspective.  However, EEG’s most startling revelation was that sleep is not a single phenomenon but consists of 2 very different types of sleep!

One type of sleep is called REM sleep because of the rapid eye movements that occur.  REM sleep is also called paradoxical sleep.  The “paradox” is that while the body appears to be entering a deeper stage of sleep as measured by a total loss of muscle tone, the brain appears to be waking up as measured by brain waves.  REM sleep is sometimes also called D-sleep because of the desynchronized brain waves that occur (more about that later).  The “D” in D-Sleep could also stand for dreaming, since this is the stage that, until recently, was thought to be the sole source of dreaming.

The other type of sleep is called non-REM (NREM) sleep.  Eye movements do occur in NREM sleep, but they are less common and much slower.  Although the most intense dreaming occurs in REM sleep, dreaming is seen in NREM sleep.  There is also passive mental activity during NREM sleep that is different from what most would consider dreaming.  NREM sleep is also referred to as S-sleep because the EEG brain waves are more synchronized (more about that later).  

NREM sleep and REM sleep alternate in approximately 90-minute cycles.  A cycle consists of one period of NREM sleep followed by one period of REM sleep and we normally experience around 3 to 5 of these cycles each night.

In addition to EEG’s use in studying sleep and cognition, it is also useful in diagnosing epilepsy, brain tumors, brain injuries, stroke, and sleep disorders.  However, while EEG is excellent for examining quick changes in cortical functioning, it is less useful for determining the neural location of a pathology. For example, tumor and stroke locations are better localized with higher spatial-resolution scans, such as computed tomography (CT) or Magnetic Resonance Imaging (MRI).  However,  EEG’s advantage is its extremely high temporal resolution (measured in milliseconds), permitting real-time measurement of quick changes in cortical functioning.  EEG is also less costly and less complicated than other brain scanning techniques. However, it is now possible to combine EEG scans with higher spatial-resolution scans to obtain the advantages of each.

This post will provide background for future posts by explaining how EEG brainwaves are used to measure sleep.  Later posts will go into the neuroanatomy, evolution, and functions of sleep.

Brainwaves are measured with electrodes.

Many universities, medical schools, and hospitals have sleep laboratories for clinical diagnosis and/or basic research.  The laboratory typically contains one or more sleeping rooms that look like nicely appointed hotel rooms.  The idea is to make the rooms as comfortable as possible to encourage users to go to sleep. While the user is sleeping, the user’s brainwaves are measured by EEG.

Fig 1. A young girl with EEG electrodes on her scalp. For sleep research, electrodes would also be placed on the chest and elsewhere. (Robin’s EEG” by Jacob Johan is licensed under CC BY-NC-SA 2.0)

In addition to EEG, other physiological variables are also measured during sleep (referred to as polysomnography). These measurements require attaching large electrodes called macroelectrodes all over the body. As you might imagine, it is often difficult to fall and stay asleep the first night. But after several nights, the individual usually begins to sleep normally.  

EEG is measured by  macroelectrodes on the scalp.  These electrodes are attached using a conductive paste secured by tape (as see in Figure 1) or embedded in a cap or net firmly secured on the head.  The secondary measures, also measured with macroelectrodes, include eye movements  (EOG: electrooculography), heart function (ECG: electrocardiography),  muscle tone (EMG: electromyography), and breathing rate.  A camera also typically records the subject’s body movements.  All of these measures can then be compared to determine their relationship to EEG, and to each other, during sleep.   

EEG is measured by a series of macroelectrodes placed in a standardized pattern on the scalp.   The number of macroelectrodes can vary depending upon purpose, from as few as 4, up to 256.  The higher numbers are most often used for medical diagnosis.  However, for sleep research, where spatial resolution is not as critical, the number is usually on the low end of this range.  Each EEG macroelectrode detects the combined electrical activity of thousands of neurons in the cerebral cortex.  Two measurable properties of brain waves are: 1) amplitude – height of the brain wave and 2) frequency – how often the brain wave occurs, measured in cycles per second (cps).  The different stages of sleep are defined by these measurements.

A Taxonomy For Describing Brain Waves

Although EEG was first used by Hans Berger on humans in 1924, sleep researchers did not use it routinely until around the 1960’s.  Prior to that time, EEG was used mainly to diagnose epilepsy and other neurological disorders.  While the original taxonomy for describing brain waves is still used for this purpose, sleep scientists have modified this taxonomy for measuring sleep.

Figure 2. Taxonomies for measuring brain waves and sleep.  In the newer sleep taxonomy NREM3 and NREM4 have been collapsed into a new NREM3.

The original taxonomy used Greek letters to designate the different EEG brain waves (right side of Figure 2).  Although not seen in Figure 2, the highest frequency, lowest amplitude brain waves are called gamma waves (30-100 cps).  These relatively rare brain waves are the most recently discovered and least understood.  They are often associated  with intense mental activity such as when an awake person has sudden insight into a previously intractable problem.  Prior to gamma wave discovery, beta waves (13-30 cps) were thought to be the highest frequency, lowest amplitude waves.  Beta waves are most often seen when the person is awake and actively problem solving, but at a less intense level.   Alpha waves (8-12 cps) possess lower frequency, higher amplitude waves and are seen during periods of “relaxed wakefulness.”  The person might be daydreaming or engaging in light meditation.  Alpha waves would also be seen in some college students as they passively listen to my 8 AM lectures and take notes without actively processing the information (hopefully they will actively process the information before the exam! 😄).  Alpha waves are also the predominate brain wave just after a person falls asleep.   Theta waves (5-7 cps) continue the trend with even lower frequency, higher amplitude waves.  In an awake person, theta waves would be associated with deep meditation but during sleep are the principle brain wave as the person begins entering deeper stages of sleep.   Delta waves (1-4 cps) are the lowest frequency, highest amplitude brain wave and occur when a  person is deeply asleep.

An important point is that cortical brain wave patterns change gradually as you pass through the different stages of wakefulness and sleep. Another point is that while EEG is the single best measure we have of sleep depth, it is not absolute.  It is possible to see gamma, beta, alpha and theta waves both when the person is awake and when asleep.  More important than individual brain waves to sleep researchers is their pattern.  This pattern, in combination with polysomnography, and in the hands of a trained sleep expert, provides a highly reliable tool for measuring the depth of sleep.

Two Taxonomies For Describing Sleep.

In order to study sleep, sleep researchers developed a different taxonomy defined by the pattern of brain waves (left side of figure 2).  In the original 1968 taxonomy, Rechtschaffen and Kales defined a single stage of REM sleep and four different non-REM (NREM) stages.  Sleep researchers were not interested in awake individuals, so patterns occurring while awake, usually involving some combination of gamma, beta, and alpha waves, were collectively put into a “wastebasket” category called Stage W (W stands for wakefulness, not wastebasket 😀).

However, research has not found the distinction between the two deepest stages of NREM sleep (NREM3 and NREM4) very useful.  As a result, in 2007, the American Academy of Sleep Medicine, collapsed these 2 stages into a new NREM3 stage, also referred to as Slow Wave Sleep.  This change can be somewhat confusing since some newer papers published in other countries, continue to use the older taxonomy.  This post will use the newer taxonomy.

Although it was originally thought that dreams were unique to REM sleep, we now know that dreams can occur in NREM sleep.  However these dreams are not as common as those occurring in REM sleep.  NREM dreams also tend to be less vivid and intense than REM dreams, have more disconnected “storylines,” and are generally less memorable.  

NREM1 begins immediately after falling asleep, when the brain waves are low frequency alpha waves interspersed with short bursts of even lower frequency theta waves (see Figure 2).  These short theta wave bursts are the first indication that the person is most likely asleep.  There can be eye movements but they are much slower than those of REM sleep.  However, the person is only very lightly asleep and is very easy to wake up.  If awoken, they will sometimes believe they were not asleep.  NREM1 is also the stage in which muscle twitches or muscle jerks known as hypnic jerks can also awaken the sleeper.  While almost everyone has experienced hypnic jerks at some time in their life, they are relatively rare for most, although they can be a regular occurrence for a few.

Several minutes later as the sleeper transitions into NREM2 sleep, theta waves become the dominant brain wave.  The occurrence of sleep spindles and K-complexes interspersed among the theta waves  (seen in Figure 2) are a sure indication that the person is now asleep.  Sleep spindles are short bursts of beta waves, and K-complexes are sudden high-amplitude delta waves lasting about a second.  The function of the sleep spindles and K-complexes is not known.  There are typically no eye movements during NREM2 and the sleeper is still easily awakened. NREM stages 1 and 2  are viewed mainly as transitions between the more important Slow-Wave and REM stages.  

NREM3 (Slow Wave Sleep) contains a mixture of theta and delta waves, with at least 20% delta waves.  NREM3  is  considered the most important and “restful” stage of NREM sleep. 

The brain waves of REM sleep are almost indistinguishable from those of NREM1 sleep.  What differentiates REM sleep is not its brain wave pattern, but rather the co-occurrence of rapid eye movements, total loss of muscle tone, and of course, dreaming.  As mentioned earlier, while the most intense dreaming occurs in REM sleep, dreaming is also observed in NREM sleep.

How is EEG measured?

Figure 3. A schematic of an EEG Macroelectrode recording the electrical activity of the apical dendrites of pyramidal neurons located in cortical layer 1. The highly branching axons of the pyramidal cell neurons as well as the many other types of neurons found in the cortex are not shown.  The EEG display represents the degree of synchrony between the input of an electrode in a particular location and a reference electrode placed elsewhere.

EEG is measured by  noninvasive macroelectrodes placed in standardized scalp locations.   Each macroelectrode detects the voltage generated in thousands of pyramidal neurons in the outer layer of the cerebral cortex closest to the skull (See figure 3).  Pyramidal neurons are large neurons with many inputs and outputs.

Action potentials in axons and graded potentials in dendrites and cell bodies generate miniscule amounts of voltage as they travel along the neuron membrane. The voltage is measured in millivolts in the neuron itself, but in even smaller microvolts when detected by an EEG macroelectrode at some distance away. However, an EEG macroelectrode is able to detect only the graded potentials of pyramidal neuron dendrites that are very close to the skull (see figure 3), the action potentials of axons are too far away.

The pyramidal neurons whose dendritic voltage is measured have their cell bodies located in cortical layers II, III, and V, while their dendrites extend into cortical layer I, the layer closest to the skull (see Figure 3).  Only the voltage of those dendrites in cortical layer I, parallel and very close to the skull, are detectable.  These potentials are initiated by neurotransmitters binding dendritic receptors and by retrograde potentials radiating out from the cell body.

The skull, meninges, and cerebrospinal fluid intervening between the EEG macroelectrode and the dendrites hamper voltage detection and the resulting weak signal must be strongly amplified to be useful.  There are also various artifacts that can distort the signal and must be filtered out.  However, when used properly, EEG macroelectrodes can provide a highly reliable index of nearby cortical activity.

How do different types of brain waves arise?

Cortical neurons, unlike most other neurons in the central and peripheral nervous system, have the unusual property of  producing spontaneous electrical activity when just “hanging out and doing nothing.”  In fact, the overall electrical activity of the cortex does not change much as a person passes from being awake to progressively deeper stages of sleep.  There is a small decline during the deepest stage of NREM sleep, however cortical neurons are definitely not resting while you sleep! What does change significantly is brain wave amplitude and frequency.

Figure 4. EEG brain waves arise from integrating  the output of the macroelectrode of interest with a reference macroelectrode in a different location.  The voltages shown here are not realistic but are to demonstrate what happens when the voltages detected by the two electrodes are synchronized or are asynchronous.

EEG brain waves are actually a derived measure that arises by adding together the output from 2 different macroelectrodes in different scalp locations.  The electrode in a specific brain location is compared against a reference electrode in a standardized location (see Figure 4).  When the voltage peaks and valleys occur at the same time (i.e. electrical activity is synchronized in the 2 cortical areas), high-amplitude, low-frequency brain waves  result, more typical of sleep.  However, if the voltage peaks and valleys are unrelated in the 2 areas (i.e are desynchronized), low-amplitude, high-frequency brain waves more typical of an awake person will be seen (see figure 4).

The different brain waves occurring in the different sleep stages are influenced by cortical neurons called  “pacemaker neurons.”  Pacemaker neurons, situated throughout the cortex, can both stimulate and synchronize the electrical activity of thousands of their neighboring neurons. The deeper the stage of sleep, the stronger is their influence (for reasons that will be explained in detail in a future post).  When deeply asleep, the pacemaker neurons not only cause the cortex’s unusual spontaneous activity, they also cause neurons throughout the cortex to fire in a synchronous fashion.

To understand why brain waves change during sleep and arousal, you also need to know that the brain is a parallel processor. Many different types of cortical processing can be carried out simultaneously, and independently, in different parts of the cortex.  For example when actively responding to the demands of the day, some cortical areas are processing sensory input, others are engaged in memory storage and retrieval, others in performing executive function, and yet other areas in motor processing and motor output. Each cortical area can “do it’s own thing” relatively independently of, and at the same time as, other cortical areas.

As the brain becomes alert and many cortical areas become actively engaged, the pacemakers’ influence diminishes.  As a result, the voltage peaks and valleys in the different cortical areas become dissimilar.  The more intense and complicated the cortical processing, the more dissimilar is the electrical activity in different locations, and the more desynchronized the EEG.

 REM and NREM sleep over the course of a night’s sleep

A hypnogram depicts the changes in the sleep stages over the course of a night’s sleep.  Figure 5 is a representative hypnogram.  When a person falls asleep, they normally enter  NREM1 sleep.  They then typically progress rapidly through the other NREM stages until reaching stage 3 around 20 minutes later (there can be variability).  The first REM bout typically begins after about an hour of sleep.

Figure 5: A representative hypnogram of a night’s sleep. From: RazerM at English Wikipedia

As mentioned earlier, sleep stages follow a cyclic pattern with each cycle consisting of a period of NREM sleep followed by a period of REM sleep.  Each cycle lasts approximately 90 minutes, a type of ultradian (less than 24-hour) rhythm.  In an adult, there are around 3 to 6 cycles per night (the person in Figure 5 had 4 complete cycles.). REM sleep typically accounts for around 20-25% of each cycle in an adult.

Many other physiological processes also exhibit ultradian rhythms.  Some processes, such as testosterone and corticosterone secretion, have similar 90-minute rhythms, while other ultradian rhythms can be longer or shorter.  Ultradian rhythms, like the 24-hour circadian rhythm, are thought to be controlled by biological clocks.

As mentioned earlier, sleep researchers consider REM and Slow Wave Sleep (NREM stage3) to be the most important types of sleep.  Interestingly, the occurrence and intensity of REM and Slow Wave Sleep are inversely related over the course of the night.   As seen in the hypnogram, Slow Wave Sleep typically occurs early in the night’s sleep, while REM bouts become longer and more intense toward the end of the night’s sleep.

Another interesting issue is that REM sleep is followed by a refractory period.  That is, after a REM bout has ended, REM sleep can not reoccur until after a certain amount of NREM sleep intervenes.  The exact cause is not known.

Falling asleep, like the co-occuring changes in EEG, appears to be a gradual process.  However the transitions from NREM sleep to REM sleep appear almost instantaneous.  This abruptness indicates the existence of a “on/off” or “flip/flop” switch mechanism, analogous to a light switch, controlling this change.  When on, this switch instantly shifts you from NREM to REM sleep.  The REM-Sleep Executive Mechanism appears to be located in the primitive brain stem (more about this in a later post).

Concluding Remarks.

EEG has certainly provided scientists with a window into the workings of the brain during sleep.  While there is still a lot we don’t know, scientific research has begun to unravel some of sleep’s mysteries.  Future posts will explore the known functions and neurological mechanisms of sleep.

Further Reading.

A great deal of this information can be found in Wikipedia under the topics: Electroencephalography and Rapid Eye Movement Sleep.  More importantly for students writing papers, these Wikipedia articles have extensive bibliographies for pursuing the information in greater depth.  While I consider Wikipedia a fantastic resource for familiarizing yourself with a topic, I personally would not allow it a citable resource.

https://wordpress.lehigh.edu/jgn2


The Vertebrate Brain: From Fish to Human.

Introduction.

Much of this post is an overview of comparative vertebrate neuroanatomy.  The major structures of the vertebrate brain as well as their primary function will be presented (focusing on their relevance to humans).  At the end,  I will show you how mother nature got from a fish brain to a human brain during the course of human evolution.

I took a comparative vertebrate anatomy course from Clark Hubbs, a well-known zoologist, at the University of Texas when I was an undergraduate about 100 years ago (actually only 55 years ago, but seems like 100 😀). This course turned out to be very influential in my professional development.   In fact, this post draws heavily on what I learned many years ago.  By comparing the organ systems of different vertebrates, Hubbs explained how they changed during evolution.  Being a psychology major, I was most interested in the brain.

Perhaps the most profound take-home lesson for me  was that while the anterior 20% of the vertebrate brain (which includes the cortex) changed dramatically during human evolution, the posterior 80%  (the brainstem) changed remarkably little.  If you want to understand the complex workings of the human cortex and consciousness, you pretty much have to study humans or our close primate relatives. However, you can learn a lot about the human brainstem by studying any vertebrate. There is definitely a vertebrate brainstem plan, with different parts doing pretty much the same sorts of things in different vertebrates.

In evolutionary parlance, we would say that the brainstem is evolutionarily conserved.  Conserved traits are those that are designed so well by Mother Nature that they do not change much over evolutionary time.  There have, of course, been brainstem changes in human evolution, often related to the human cortex acquiring functions controlled exclusively by the brainstem of lower vertebrates.   However to me, the vertebrate similarities are more remarkable than the differences.

The Primitive Vertebrate Brain Plan.

The first vertebrates were fish.  The primitive vertebrate brain seen in Figure 1 is basically a schematic of a fish brain.  While an actual fish brain wouldn’t look exactly like my schematic, you would be able to see the similarities. It should also be mentioned that the brain is a bilateral organ with every structure occurring in both the right and left sides of the brain.

Figure 1: Primitive Vertebrate Brain with Major Structures.

Let’s get some terminology out of the way first.  There are several schemes for dividing up the brain (see figure 1).  The simplest is to divide it into 3 parts: forebrain, midbrain and hindbrain.  However, anatomists like to break it down further and use more technical terms.  A more technical term for forebrain is prosencephalon.  The prosencephalon can be further subdivided into the telencephalon and diencephalon.  The midbrain becomes the mesencephalon while the hindbrain becomes the rhombencephalon.  The rhombencephalon can be further subdivided into the metencephalon and mylencephalon. 

When considering the brains of nonhuman vertebrates, anterior refers to the front part of the brain, posterior to the back, dorsal to the top, and ventral to the bottom.  Because the human brain has a different orientation in relation to the body, human neuroanatomists use the terms superior and inferior to replace dorsal and ventral when referring to the brain.

You also need to know that brain tissue consists of either grey matter or white matter.  Grey matter is composed mainly of neuron cell bodies (whose membranes are grey), while white matter comes from myelinated fiber tracts that interconnect different areas of grey matter (axonal membranes in these fiber tracts are covered by white myelin sheaths providing the fiber tracts white color).  Throughout the brain there are clusters of grey matter interspersed among the white matter.  These clusters of neuron cell bodies are called nuclei by neuroanatomists (which is different from how this term is used by a cell biologist) and  there are many different nuclei, and collections of nuclei, throughout the brain.   

And finally you need to know that the brain is a massive parallel processor with different types of processing able to occur simultaneously.  This division of labor is accomplished by having different nuclei and neural circuitries for different functions.  These circuitries often do not interact until their modular processing is complete.

Telencephalon.   

The olfactory bulb in the front of the brain (figure 2) receives input from the olfactory nerve and provides the initial unconscious processing for the sense of smell.  The olfactory nerve is the most anterior of the 12 pairs of cranial nerves that enter the brain.  Cranial nerves are composed of both sensory and motor neurons and service mainly the head and face.  The rest of the body is similarly serviced by 31 pairs of spinal nerves that connect with the spinal cord.  However, one cranial nerve, the vagus nerve, services both parts of the head and as well as many organs in the lower body (vagus means “wandering”).  

While most vertebrates have relatively large olfactory bulbs, humans have small ones.  This difference reflects olfaction (and pheromones) playing a much larger role in the social/sexual lives of most non-human vertebrates, while vision subserves much of this function in humans. In fact, a general principle is that the relative size of a brain structure is related to its importance for a particular species.  Not only is the olfactory bulb relatively small in humans, there are also fewer types and numbers of olfactory receptors.  In addition, a secondary vertebrate olfactory system, the vomeronasal system, is either vestigial or absent in humans.  As Hubbs put it, “most vertebrates smell in color, while humans smell in black and white.”

Figure 2. The telencephalon

The olfactory system is thought by some to be the earliest and most primitive sensory system and plays by different anatomical rules than other sensory systems.  In humans, the pathway from the olfactory bulb to the cortex is different than for the other senses, and more processing occurs below the level of conscious awareness.

The dorsal bump in the telencephalon, and everything inside of it, is called the cerebrum (see figure 2).  The cerebrum has a thin outer covering of grey matter called the cerebral cortex, or just cortex.  The cortex is essentially a massive nucleus.  During human evolution, the size of cortex expanded dramatically and acquired some of the sensory and motor capabilities managed by the brainstem of lower vertebrates.  In addition, this evolution eventually led to the complexities of human consciousness.  More about the cortex and consciousness in another post.

Much of the inside of the cerebrum is white matter consisting of fiber tracts interconnecting different parts of the cortex to each other as well as to nuclei throughout the brain.  Most connections are “2-way streets.”  Buried in the cerebrum’s white matter are two important systems, the limbic system and the basal ganglia.  Both consist of a number of interconnected nuclei.  Although both systems operate below the level of conscious awareness, the outcomes of their processing play major roles in assisting the conscious activities of the cortex.   

The nuclei of the limbic system include the  hippocampus, septum, amygdala, and nucleus accumbens.  The hippocampus and septum are necessary to help the cortex consolidate short-term memories (transient electrical events) into long-term memory (relatively permanent structural changes).  In fact, the memory problems of Alzheimer’s Disease begin with a loss of acetylcholine neurons that provide input into the hippocampus which, in turn, impairs the hippocampus’s ability to support the cortex’s consolidation process.  In the early stages of Alzheimers, the old long-term memories are still there, but the person has difficulty forming new ones.  As a result, such an Alzheimer’s patient can regale you with stories of their youth, but can’t remember what happened to them yesterday.  As the disease progresses the memory problems worsen as both the hippocampus and cortex begin to degenerate and existing long-term memories are eventually lost as well.   

The amygdala, on the other hand, interprets emotional situations to provide input important in forming emotional memories in the cortex.  Post-traumatic stress disorder (PTSD) is thought to arise from intensely traumatic events causing amygdala hyperreactivity.  The resulting memory can later be reactivated by any situation remotely reminding the person of the traumatic event, causing an incapacitating “fight or flight” reaction. 

And finally, the limbic system’s nucleus accumbens helps the cortex to interpret the hedonic value of all forms of reward (i.e. food, drink, sex, warmth, etc) and also plays a central role in providing the motivation necessary for both learning and drug addiction (many experts consider drug addiction to be a type of maladaptive learning).

The different nuclei of the basal ganglia are critical for helping the cortex plan and execute motor movements.  The globus pallidus is more important in initiating movement, while the caudate nucleus/putamen, in terminating it.  Proper functioning requires dopamine input into the caudate nucleus/putamen from a midbrain nucleus called the substantia nigra.   Parkinson’s Disease arises from the selective degeneration of the substantia nigra, which removes this dopamine input.   

Huntington’s Disease is another motor disease of the basal ganglia.  However, in this case, a loss of GABA-secreting neurons in the basal ganglia itself is the cause.  (GABA is the principle inhibitory neurotransmitter throughout the brain.)  As the disease progresses other types of neurons in the basal ganglia and cortex are also affected.  Both motor diseases are sometimes accompanied by psychotic symptoms suggesting that the basal ganglia, through its connections with the cortex, may play a role in psychological functioning.

Diencephalon.

The diencephalon sits right behind the telencephalon and contains the thalamus, epithalamus (containing the pineal gland), and hypothalamus.  Each of these general areas contain multiple nuclei with different functions.  The classification scheme presented here considers the diencephalon as the beginning of the brainstem (although some neuroanatomists consider the mesencephalon to be the beginning.  It can be confusing that different neuroanatomists don’t always agree on terminology 🤬).  The pituitary gland sits just below the hypothalamus and just anterior to the pituitary is a distinctive landmark called the optic chiasm.  The optic chiasm  is where the optic nerve enters the brain and is caused by half of the nerve fibers on each side crossing over to the other side.

Figure 3. Diencephalon

Moving to the top of the diencephalon, the epithalamus contains the pineal gland.  Earlier I stated that all structures in the brain are bilaterally represented.  I lied!  The pineal gland is the human brain’s only unilateral structure with the 2 halves fused into a single midline structure.  This unique arrangement led the famous scientist/philosopher Descartes to suggest that the pineal gland is the “seat of the soul.”  I’ll leave it to others to debate that suggestion.

In vertebrates, every cell in the body has its own circadian clock whose time keeping is linked to the daily synthesis and degradation of certain proteins.  Circadian clocks optimize physiological and behavioral adaptation to different times of the day.  For example, if food is available only at certain times of the day, biological clocks prepare the organism to physiologically and behaviorally take advantage.  Virtually all physiological processes show circadian rhythms, functioning at their highest level at certain times of the day or night.

Proper circadian timing is clearly important for humans. The tiredness and malaise from jet lag is because the circadian clocks are temporarily decoupled from the local time. Fortunately recovery typically takes only a few days and does not usually have lasting effects.  However, chronic jet lag, as seen in shift workers, is associated with significantly increased illness, disease, and mortality.

A problem with each cell in the body having its own circadian clock is that each clock’s periodicity often differs slightly from 24 hours, and also slightly from each other.  Allowed to “free run”, the cellular clocks would quickly get out of sync with the 24-hour cycle and with each other.  This asynchrony would cause the dysfunctions of jet lag.  Mother nature has solved the problem by having one clock to rule them all.   This clock is known as the “master clock”, which keeps all the other clocks synchronized with both local time and with each other.

However, the master clock may also have a periodicity that isn’t exactly 24 hours.  For example, in humans, the master clock, for unknown reasons, has an average periodicity of around 25 hours (it can vary a bit from one individual to the next).   The master clock solves this problem by “re-setting itself” to the local time every day.  Resetting is triggered most often by light onset in the morning although other sensory cues that occur at approximately the same time every day can also be used (such as the crowing of a rooster, or the ringing of an alarm clock).  By resetting the human master clock back one hour each day, the body’s time keeping is kept in step with that of the environment.   However, the human master clock is capable of  retarding or advancing itself only a couple hours each day.  So if your clock gets more than a couple of hours out of sync with the local time you experience jet lag until the master clock can resynchronize itself with the local time.

The pineal gland is the master clock of reptiles and birds.  In fact, in some birds, where light can penetrate their paper-thin skulls, light-sensitive photopigments similar to those in our eyes allow the pineal to actually sense light to reset the master clock.  Even stranger, in some lizards the pineal extends through the skull to become a third eye in the forehead.  However, this light-sensing “eye” is not for vision but for entraining the master clock. 

The pineal gland of vertebrates, including humans, also exhibits a circadian rhythm in the secretion of the hormone, melatonin.  Melatonin concentrations are highest at night while sleeping and promote sound sleep.  In fact, melatonin is sold over-the-counter in health food stores and pharmacies for this purpose.    Also supporting melatonin’s sleep-promoting effect is that the restless sleep from watching tv or using a phone or tablet just before bed-time, is because the blue light from these devices inhibits nighttime melatonin secretion.  in addition, after flying on an airplane to distant locations, melatonin, taken just before bedtime not only promotes sleep, it also shortens the period of jet lag. 

In temperate-climate vertebrates, melatonin has also been implicated in regulating seasonal behaviors such as hibernation, migration, food hoarding, etc.   These seasonal changes, in some cases, are influenced by the increased melatonin secretion during the longer nights of the winter.  There is some evidence for human seasonality (e.g. seasonal affective disorder and births peaking in summer and fall), but the data are not as robust as for many other vertebrates.  Perhaps that’s because much of human evolution occurred in the tropics where the seasonal changes are not as great.

The structure immediately below the epithalamus/pineal gland is the thalamus.  The job of the thalamus is to serve as a relay station to send sensory information up to the cortex.  With the exception of olfaction, sensory information entering the brain and spinal cord makes its way to the thalamus.  Neurons in the thalamus then relay this sensory information up to the cortex.  To accomplish this task, the thalamus contains a number of different nuclei, each specializing in relaying a different type of sensory information.  Vision, hearing, touch, taste, temperature, pain etc. are then relayed separately to different cortical areas for conscious processing and awareness.

The structure below the thalamus is appropriately called the hypothalamus.  While relatively small (in humans about the size of an almond), the hypothalamus plays an oversized role in physiology and behavior.  In terms of behavior, the hypothalamus controls the primitive, largely unconscious,”animalistic” behaviors that we share with other vertebrates.  Hubbs, my comparative anatomy teacher, had a great mnemonic for remembering the names of these behaviors.  He called them the “4 F’s: feeding, fighting, fleeing, and mating.”

When I was an undergraduate 55 years ago, we referred to the pituitary gland, just below the hypothalamus, as the master gland because it produces a large number of different hormones that, in turn, control the other endocrine glands of the body.  However, we now know that the hypothalamus, through hormonal and neural connections, controls the pituitary.  So, the hypothalamus is the true master gland playing a critical role in proper body functioning and homeostasis.  

In mammals, the hypothalamus also has a third important function.   Unlike reptiles and birds, a nucleus in the hypothalamus, the suprachiasmatic nucleus, serves as the master clock.  (Suprachiasmatic refers to its location immediately above the optic chiasm.)  This nucleus makes sure all the mammalian circadian clocks are synchronized to the time of day and to each other. 

Why the mammalian master clock would be different from other vertebrates likely has to do with an evolutionary change in the relative position of the pineal gland (which I’ll explain in more detail later).  Instead of being on the dorsal surface of the brain, as it is in birds and reptiles, the mammalian pineal is buried deep inside the brain, presumably impairing its ability  to entrain its daily time keeping.  A better option for mammals is to use light detected by the eye rather than the pineal to reset the clock.  The suprachiasmatic nucleus, which is just above the optic chiasm, is well situated for this purpose.  In fact a small number of optic nerve fibers synapse in the suprachiasmatic nucleus, making it highly efficient for light to reset the mammalian master clock each day.

Mesencephalon (Midbrain). 

The mesencephalon or midbrain consists of a dorsal tectum and a ventral tegmentum.  The tectum contains the primary sensory and motor centers of all non-mammalian vertebrates.  As mentioned earlier, these functions have been acquired by the cortex in mammals.  The tegmentum, like other parts of the ventral brainstem, contains many fiber tracts running up and down the brain.  There are also 2 cranial nerves that connect with the brain here.  In addition, there is the most anterior part of a diffuse polysynaptic pathway running up the brainstem called the reticular activating system or just reticular system. 

Figure 4. Mesencephalon

Within the tectum, sensory function is dorsal to motor function.  The first “minibump” of the tectum is the optic tectum, the primary visual processing center of all nonmammalian vertebrates.  In mammals the cortex has acquired these visual processing functions to more effectively bring them under conscious control.  Because of its primary role, the optic tectum is relatively larger in non-mammalian vertebrates.   (In humans, the optic tectum is called the superior colliculus)

There are pluses and minuses to having visual processing in the tectum.  The advantage is the ability to respond quickly to visual input.  The slowest aspect of neural communication is synaptic neurotransmission.  Any response managed by tectal processing requires fewer synapses and is inherently quicker than one managed by the cortex.  The advantage to cortical processing, on the other hand, is that the processing is brought under greater conscious control.  Conscious processing allows for more complicated and nuanced responses that can be tailored to a wider variety of circumstances.  In the case of mammals, and particularly humans, a larger response repertoire is more adaptive than responding quickly.  However, cortical processing remains quick enough for most tasks (we’re talking fractions of a second difference).

We humans still have a functional optic tectum/superior colliculus that is still processing visual input.  So what is it doing  in humans?  There are some visual reflexes, even in mammals, that must be exceedingly quick to be effective.  To this end, the superior colliculus controls eye and head movements that allow us to quickly focus our gaze on objects that draw our attention.  These responses occur automatically and do not require conscious processing.  If the cortex were to control these responses, they would be slower and less adaptive.

There is also evidence that the human superior colliculus may be capable of more complicated unconscious reflexes.  For example there are retinotopic maps in the superior colliculus where locations in the retina correspond to specific locations in the superior colliculus.  This relationship suggests that the superior colliculus, like the cortex, can create a representation of the visual field.  Perhaps this ability underlies a very interesting phenomenon called “blindsight.”  This rare phenomena is seen in individuals blinded by damage to their visual cortex while leaving the tectum undamaged.  Very strangely, such blind individuals have been observed to respond appropriately to certain visual stimuli.  However, if you ask them why, they are not consciously aware of the reason.  Such quick, unconscious, but complicated reflexes could be highly adaptive in responding to dangerous (or rewarding) stimuli that require an absolutely immediate response to be effective.

Cortical versus tectal visual processing illustrates another interesting evolutionary principle.  When mother nature figures out a “better way” of doing something, she often doesn’t get rid of the old way.  She simply superimposes the new way on top of the old way.   This approach often creates some redundancy, illustrating yet another important evolutionary principle. The more important a brain process is to fitness and survival, the more likely it is to be controlled by redundant backup systems.  That way if one system fails, another has some potential to step in and take over.

The evolution of mammalian hearing is similar to that of vision.  The auditory tectum is the primary auditory center for all non-mammalian vertebrates.  However in mammals, the cortex has acquired this function.  However, the human auditory tectum/inferior colliculus continues to mediate quick unconscious reflexes such as the auditory startle reflex.

In the ventral tectum just below the sensory areas is the Red Nucleus, the primary motor center of the primitive vertebrate.  This nucleus allows sensory information processed in the tectum to be reflected out to the muscles for quick, but unconscious, motor responses.  There are  2 multisynaptic pathways from the Red Nucleus to the ⍺-motoneurons of the brain and spinal cord that are collectively called the extrapyramidal motor system. The ⍺-motoneurons then carry the message from the brain and spinal cord to the muscles to cause muscle contractions.  The extrapyramidal system can produce unconscious, reflex-like behaviors when acting upon sensory information from the tectum.  However, in mammals the extrapyramidal system can also be accessed by the cortex allowing for conscious body movements as well.

If you guessed that there must also be a pyramidal motor system, you’d be correct!  The pyramidal system is an evolutionarily newer motor pathway allowing the mammalian motor cortex another way to access ⍺-motoneurons.  In fact, its pathway is even more direct than the extrapyramidal motor system making it look like it should be the primary motor system.  However, it is actually a supplementary motor system that adds additional motor functionality to mammals.  (As an aside, the pyramidal motor system was named by an over-imaginative neuroanatomist who thought this pathway, running along the base of the brain, looked like a pyramid in cross section.).

The primary purpose of the pyramidal motor system is to allow the cortex to control conscious dextrous movements of the distal limbs.  A good example would threading a needle.  To do so requires feedback from the sense of touch that must then be quickly reflected out to the appropriate finger muscles  to be effective.  The relative size of the pyramidal motor system in mammals correlates with the degree of manual dexterity.  Dogs have relatively small systems while humans have large ones.  The pyramidal motor system provides humans with the highest manual dexterity of any species on the planet.  However, if you’re guessing that humans have the most developed pyramidal motor system, you’d be wrong.  It turns out that many monkeys have even more developed systems.  That’s because monkeys have dexterity in both their hands and their feet.

However, the two systems typically work together in humans in a complementary fashion.   The extrapyramidal system is better at controlling the muscles of the truck and proximal limbs, while the pyramidal system is particularly good at controlling the movements of the hands and feet.  There is some overlap, allowing one system some capability to take over  if the other doesn’t function properly.  For example, monkeys with nonfunctional pyramidal systems are clumsy at dextrous hand and foot movements but are otherwise able to do many things relatively normally.  On the other hand, a totally dysfunctional extrapyramidal system would likely be fatal.

In summary, the extrapyramidal system is the basic, original motor system which, in a fish, operates below the level of conscious awareness.  However over evolutionary time, the extrapyramidal system was brought under conscious control while at the same time continuing to operate unconsciously as well.  As mammals developed dexterity in the distal end of their limbs, the pyramidal system evolved to support this dexterity.

The tegmentum is the ventral portion of the mesencephalon.  The tegmentum contains the anterior end of a diffuse, polysynaptic pathway called the reticular activating system.  This system consists of 20+ interconnected nuclei, extending throughout the length of  the brainstem. The reticular system receives input from all the different sensory systems and at one time was thought to be a redundant system for processing sensory input.  We now know this is not the case. The reticular activating system serves mainly to influence the cortex’s state of consciousness during wakefulness and sleep.  More about reticular system functioning in another post covering the neuroanatomy of sleep.

Located in the dorsal reticular system are a series of  8 Raphé nuclei.  The first 2 are in the mesencephalon, 3 more in the pons, and the final 3 in the medulla.  These nuclei are the brain’s source of the neurotransmitter serotonin.  Despite constituting an exceedingly small fraction of the brain, the axons of the Raphé nuclei release their serotonin virtually everywhere in the brain and spinal cord.  The anterior Raphé nuclei service the more anterior parts of the brain, while the more posterior nuclei service the more posterior parts of the brain and spinal cord.  Serotonin is released both synaptically and extrasynaptically by the Raphé neurons to modulate overall brain functioning. (Extrasynaptic neurotransmitter release is discussed in another post in the section entitled “The Brain’s Serotonin System.)

Serotonin concentrations in the brain’s extracellular fluid show a pronounced circadian rhythm, highest when awake and active, lower when awake and inactive, even lower during non-REM sleep, and lowest during REM sleep.  In fact body movement is one factor known to promote serotonin release.  Brain serotonin concentrations affect such diverse phenomena as mood, sleep and sex drive.

However, serotonin is probably best known for its role in Major Depression.  Selective serotonin reuptake inhibitors (SSRIs), are the first-line antidepressant drugs and clear depression by boosting brain serotonin concentrations.  Behavioral methods that raise brain serotonin concentrations also relieve depression in some cases.  For example, daily exercise is the best non-drug treatment for depression.  And for initially clearing a depression,  sleep deprivation, or selective REM-sleep deprivation, which reduces time spent in periods of low serotonin concentration, will sometimes help. However, SSRIs and behavioral methods don’t help all depressed patients and there are clearly factors other than just serotonin at work in depression. A more in depth treatment of this topic is found in another post

It is worth mentioning that serotonin is not produced exclusively by neurons in the brain.  In fact, 98% of the body’s serotonin  is produced outside the brain by specialized cells in the digestive tract where it acts as a hormone to influence gastric motility. However, since serotonin does not cross the blood brain barrier, the brain is directly affected only by its own serotonin.

Metencephalon.

The dorsal  metencephalon is called the cerebellum, while the ventral metencephalon is the pons.  The cerebellum resembles the cerebrum in possessing an outer cortex of grey matter with inner white matter interspersed with nuclei.   The cerebellum is best known for its role in movement and coordination.

Fig 5. Metencephalon

The cerebellum plays an important role in helping both cortical and midbrain motor areas carry out complicated motor movements.  To do so, the cerebellum encodes memories of complex coordinated motor movements.  These memories are sometimes referred to as “motor melodies” because the precise timing of muscle contractions underlying these movements resembles that of the musical notes necessary to produce a melody.  The motor melodies of the cerebellum can be incorporated into both conscious and unconscious motor movements.

The workings of the cerebellum underly the ability of athletes, dancers, musicians, artists, and others to perform their amazingly coordinated movements.    The cerebellum acquires and refines its motor melodies through experience and learning….practice, practice, practice.

As with other processes in the brainstem, the motor-melody memories are encoded below the level of conscious awareness.  For example, while a person consciously knows whether or not they can ride a bicycle, they do not consciously know which muscles must contract, for how long, and in what order.  That’s the job of the unconscious cerebellum.  Which brings up the interesting dichotomy between being a good performer of a movement and teaching that activity to someone else.  In order to perform the movement you must have the motor melodies encoded in your cerebellum, but to be a good teacher or coach, you must have the relevant (but different) information stored in your conscious cortex.  That’s why a good athlete isn’t necessarily a good coach and vice versa.

The pons resembles other parts of the ventral brainstem with fiber tracts running up and down the brain, part of the reticular activating system, as well as 4 cranial nerves that enter and exit here.  There are also various fiber tracts coursing through here as well.  However, a nucleus worth describing in more detail is  the Locus Coeruleus (See figure 5).

The neurons of the Locus Coeruleus use norepinephrine as their neurotransmitter.   Like the Raphé nuclei, the Locus Coeruleus is part of the dorsal reticular system.   In fact, the Raphé nuclei and the Locus Coeruleus have a lot in common.  The neurotransmitters of both are classified as  monoamines.  Both send out unmyelinated axons to synapse both synaptically and extrasynaptically throughout the CNS.  Both spontaneously release their neurotransmitters in a circadian fashion, being highest during the day and lowest during sleep.    In addition, both neurotransmitters are also produced outside the brain by endocrine tissue where they act as hormones rather than neurotransmitters.  Neither molecule crosses the blood brain barrier so the brain is not directly affected by concentrations outside the brain.  And finally, low brain levels of both have been implicated in depression.  While SSRI’s are the first-line antidepressants,  selective norepinephrine reuptake inhibitors (SNRI’s), are also effective in some patients by selectively boosting brain norepinephrine levels.  The role of these monoamines in depression is covered in more detail elsewhere.

However the main function of the brain’s norepinephrine is to serve as the neurotransmitter of the sympathetic branch of the autonomic nervous system.  The autonomic nervous system controls the unconscious automatic processes necessary to keep brain and body functioning optimally and is composed of sympathetic and parasympathetic branches that generally have opposite effects.  Activation of the sympathetic nervous system causes what are known as “fight or flight” responses to help vertebrates cope with emotion-provoking situations.

For example, in the cortex, high norepinephrine concentrations cause “vigilance,” extreme attentiveness to sensory input.  Outside the brain, norepinephrine is also the neurotransmitter of sympathetic nervous system neurons that prepare the muscles and circulatory action for action. In addition, norepinephrine causes all sensory organs  to operate at peak efficiency.  Norepinephrine also puts the body into a catabolic state optimizing the release of stored carbohydrates and fats to supply the energy needed to deal with the emotional situation.

However, that’s not all folks.  The sympathetic nervous system also activates an endocrine gland, the adrenal medulla to release norepinephrine and epinephrine into the blood where they act as hormones. Both hormones then circulate throughout the body via the blood and add to the norepinephrine being released by the sympathetic neurons.  So norepinephrine is both the neurotransmitter, and hormone, of sympathetic arousal.  (Epinephrine and norepinephrine are also known as adrenalin and noradrenalin respectively). Another good example of a critical biological process exhibiting redundancy!

By the way, as a teacher, I always found redundancy to be an important teaching tool. My teaching philosophy was if you throw enough cow paddies against the wall (we actually used a different term for cow paddies), eventually some of them start to stick! (A little Texas humor to break up the seriousness! 😀).

The parasympathetic system is controlled by the medulla and its role will be described in more detail in the next section.

Myelencephalon.

Figure 6. Mesencephalon

The myelencephalon contains the medulla oblongata or just medulla, the most posterior and primitive section of the brain, which connects the brain with the spinal cord.    The medulla houses both sensory and motor fiber tracts from the spinal cord connecting with more anterior nuclei.  The medulla also contains the most posterior part of the reticular activating system important in sleep and arousal.  Also 4 of the 12 cranial nerves enter and exit the brain at this level.  Again the primary purpose of the cranial nerves is to service the sensory and motor functions of the face and head. And some nuclei in this area are critical components of the parasympathetic nervous system.

The parasympathetic branch of the autonomic nervous system predominates when you are not facing an emotion-provoking situation, which for most of us, is most of the time.  The parasympathetic nervous system activates the anabolic responses of the body that favor energy storage, bodily repair, and metabolism that supports reproduction.  The terms “feed and breed” and “rest and digest” are often used to describe the activities of the parasympathetic nervous system.

Some of the automated processes of the parasympathetic system are critical for sustaining life, including breathing, heart rate, swallowing, energy storage, digestive processes, and vomiting. These processes are controlled by parasympathetic motoneurons that release acetylcholine into target organs.  Acetylcholine generally has opposite effects to the norepinephrine in target tissues.

It is a bit paradoxical to me that the least complicated and most primitive part of our brain controls the processes essential for sustaining life.  Consistent with this relationship, damage to to the medulla is much more likely to be fatal than damage to our much, much larger and more complicated cortex.

How do you get from a fish brain to a human brain?

This is probably why you began reading this post and were wondering if we would ever get here.

While there were many selective forces shaping the evolution of the human brain, 2 stand out as most important in producing the brain’s conformational evolution from fish to man.  By far the most important has been the massive increase in the size of the cerebrum compared to the rest of the brain.  In a fish, the cerebrum is approximately 10-20% of the brain’s mass, while in humans it is 95%!  This change has been gradual over evolutionary time.

Figure 8. Schematics of the steps in the evolution of the human brain as seen in a midsagittal (down the middle) section.

As seen in figure 8,  the reptile brain resembles the fish brain, but with a larger cortex.  With the evolution of mammals, the cerebrum became even larger. However as the cerebrum became larger, the mammalian skull limited its ability to expand dorsally.  As a result cerebrum expansion was directed in posterior and lateral directions resulting in the diencephalon and mesencephalon becoming completely covered by the expanded cerebrum.  Structures that were originally in the dorsal part of the fish and reptile brain are now in the middle of the mammalian brain, covered on both the top and the sides by the cerebrum.

The second force shaping the orientation of the human brain involved our primate ancestors shifting from being quadrapeds, walking on 4 legs,  to bipeds, walking on 2 legs.  The original mammals, like the reptiles from which they evolved, were quadrapeds.   Fish, reptiles and quadraped mammals all have a straight-line neuraxis  (an imaginary line running down the middle of the brain).  By becoming bipedal and standing upright, the orientation of the human head, in its orientation to the rest of the body, had to change.  This change put a roughly 90 degree kink in the middle of the human neuraxis.  If this change hadn’t occurred we would walk around looking straight up at the sky all the time which would cause us to perpetually bump into things and our early bipedal ancestors would have gone the way of the Dodo. 😀

While I use the term, “brainstem” to describe all the vertebrate brains, the term actually arose from studying human brains.  If you use your imagination and consider the cerebrum (and cortex) to be a flower, the rest of the brain holds it up and is the “stem”.  Because of the change in the human neuraxis, you can also now see how the the superior and inferior colliculi which sit side by side in most vertebrates got their designations as superior and inferior in the human brain.

So there you have it, gradual changes over evolutionary time have transformed the fish brain into a human brain!  In other words, we humans are just highly evolved fish!  Just kidding!  Nonetheless, comparative anatomy makes excruciatingly clear our close biological kinship to the rest of the animal kingdom!

Final Remarks.

My brief, and somewhat biased, excursion through comparative neuroanatomy emphasizes the structures and systems I find most interesting and, being trained as a biologically oriented psychologist, most relevant to human physiology and behavior.  I left out structures that others would likely have included.  However, you can fill in the the details by reading any comparative anatomy or human anatomy textbook.

https://wordpress.lehigh.edu/jgn2

Addiction V. Why do some drug users become addicted and others not?

Introduction.

Some people are clearly more addiction prone.  While both environmental and biological factors contribute, a recent publication by Li et al (2021) provides important new information about the role of brain biology.  In prior research by other investigators, several brain areas had been implicated in protecting the brain from addiction, as well as a role for the neurotransmitter, serotonin.   However, the exact areas, and how serotonin interacts with these areas, was not known.  Li et al’s research confirms the importance of serotonin, as well as identifies the neuroanatomy through which serotonin exerts its effects.  The findings also have broader implications for understanding individual differences in addiction liability.

To provide context, some background material will be presented first.

Addiction is caused by highly maladaptive learning.

Learning is operationally defined as a relatively permanent change in behavior brought about by experience.  By this definition, drug addiction is a type of learning.  What is learned is the expectation of reward.  With repeated drug use, this expectation intensifies, making drug use increasingly difficult to resist.  When the urge becomes nearly irresistible, the individual is said to be addicted.

Figure 1. A cartoon showing the proposed conflicts between conscious and unconscious parts of the brain in a drug addict.

Unfortunately, once established, addiction appears to play by different rules than many other types of learning.  For example, most learned behaviors are abandoned when they later become associated with bad outcomes.  Not so for addiction. Many addicts continue drug use after their health is impaired, their marriages are destroyed, their jobs lost, or they find themselves in legal jeopardy.  Addicts are often aware that their addiction is bad for them, they just can’t help themselves.

One possible explanation, explored in a previous post, is that the expectation of drug reward may be encoded, at least in part, in primitive, unconscious parts of the lower brainstem, resistant to influence by conscious thought processes (Fig 1).   However, not totally resistant.  While around 20% of human cocaine users eventually become addicted, the other 80% seem able to resist the urges underlying compulsive drug use. 

The process of discontinuing a learned behavior is referred to by psychologists as extinction.  In the parlance of psychology, the problem of  an addicted drug user is an inability to extinguish drug use when it leads to negative outcomes.  Extinction is considered by psychologists to be caused by new learning superimposed upon, and overriding, older learning.  The older learning (expectation of drug reward) doesn’t go away, but rather the new learning (that taking the drug has bad consequences) prevents the old learning from being acted upon.   Li et al’s research addresses why addicted users are unable to extinguish their drug use as circumstances become negative.

The reward pathway of the brain.

Figure 2: A schematic of the human brain showing the reward pathway in red.  The neurons of this pathway have their cell bodies in the ventral tegmental area and their axons project up to the nucleus accumbens where they secrete dopamine to cause the sensation of reward.

One of the great discoveries of neuroscience is that a final common brain pathway, highly similar in all vertebrates, plays a central role in all forms of reward.  Natural reinforcers such as food, drink, sex, warmth, social interactions, etc. are all experienced as rewarding because they activate this pathway, as do rewarding drugs and electrical stimulation of certain parts of the brain.

The reward pathway originates in the ventral tegmental area, whose dopamine-releasing axons project to the nucleus accumbens  (See Figure 2).  Dopamine elevations in the nucleus accumbens causes the experience of reward.  However, the manner in which drugs activate this pathway varies.  Cocaine and amphetamine activate the nucleus acumen’s dopamine reward system directly, while other addictive drugs (such as opiates, alcohol, benzodiazepines and THC) initially act through other neurotransmitter systems that indirectly lead to dopamine elevations in the nucleus accumbens.  Highly rewarding drugs, such as cocaine or heroin, generally cause more intense dopamine elevations than natural reinforcers which contribute to the drug’s addictiveness.

How Does Cocaine Activate the Reward Pathway?

Figure 3. Cocaine blocks the reuptake transporters of dopamine, norepinephrine, and serotonin. Reuptake serves to: 1. remove the neurotransmitter from the extracellular fluid so as terminate receptor binding and 2. recycle the neurotransmitter for reuse. By blocking these 3 transporters, cocaine raises extracellular dopamine, norepinephrine, and serotonin levels in many brain areas.

Cocaine produces the sensation of reward by blocking dopamine reuptake transporters in the nucleus accumbens.  These membrane transporters serve to remove extracellular dopamine from the synapse by actively moving it back inside the neuron where it can be reused (see figure 3) .  Cocaine disables this transporter.  As a result, cocaine causes dopamine to build up in nucleus accumben’s  synapses.  The enhanced binding due to this buildup causes cocaine to be experienced as rewarding.

However, an important issue that I will return to later, is that cocaine (administered by injecting, snorting, smoking, or eating) goes everywhere in the brain where, in addition to causing reward, it produces other effects.  For example, dopamine elevations in the dorsal striatum contribute to an increase in motor activity.

Cocaine also blocks norepinephrine and serotonin reuptake transporters throughout the brain causing the the synaptic buildup of these neurotransmitters as well.   The resulting norepinephrine elevations cause sympathetic arousal (i.e. the fight or flight response) which contributes to heightened activity and also puts your body on high alert.   On the other hand, the serotonin elevations provide an antidepressant effect (however, cocaine’s addictiveness and other effects make it undesirable as an useful antidepressant).  Despite cocaine being highly addictive, Li et al found that cocaine-caused serotonin elevations paradoxically reduce cocaine’s addiction liability in mice  (more about that later).

Recreational cocaine users take cocaine mainly for its rewarding properties.  While the reward from repeated cocaine use is necessary for an addiction to develop, it is not sufficient.  The research by Li et al provide evidence that other brain areas influence whether a cocaine “addiction” actually develops.

A Mouse Model of Cocaine Addiction.

Fig 4. A freely moving rat pressing a bar to self-administer an intraperitoneal drug infusion (from Wikipedia).  A mouse set-up would be very similar .

Humans are not the only organisms capable of drug addiction.  Nonhuman animals, such as mice and rats, like the same drugs as humans and, if given the opportunity, will self administer them.  With continued administration, some eventually develop the compulsive, uncontrollable use characteristic of drug addicts.  In some cases, these animals, like humans,  have died from self-administered overdoses.

In Li et al’s research, mice were trained to self-administer cocaine by pressing a bar (see Fig 4 ).  When pressed, cocaine solution was infused into their  peritoneal cavity (the body cavity containing the stomach, intestines, liver etc) where it was absorbed into the blood.  As found in many previous studies, once mice learned that bar pressing leads to cocaine administration, they readily and “enthusiastically” pressed the bar.

Twelve once-per-day sessions initially established the cocaine self-administration behavior.  Once established, each cocaine self-administration was then paired with a painful foot shock.  The mice responded to the paired shock by dividing themselves into 2 categories.  Around 20% persisted in their cocaine administration despite the foot shocks (referred to as “persisters”) while 80% ceased administration (referred to as “renouncers”). Like human cocaine addicts, the persisters continued to self-administer despite negative consequences.  It is interesting (although perhaps a coincidence) that the percentage of mouse persisters was similar to that of human cocaine users who become addicted.  

Li et al determined that the difference between persisters and renouncers could not be explained by differences in learning the self-administration procedure, in how rewarding the cocaine was experienced, nor in how painful the foot shocks were perceived.  These results indicated that something else must be influencing whether cocaine administration results in mouse “addiction.”

Optogenetic self stimulation of the reward pathway.

Electrically stimulating the ventral tegmental area, which also elevates dopamine in the nucleus accumbens, is both rewarding and addictive.  However, the electrical stimulation quickly spreads out from the brain area being stimulated, preventing reliable neuroanatomical/neurochemical inferences.  To get around this problem, Li et al  took advantage of a newer technique called optogenetic stimulation.  Optogenetic stimulation is not only better at confining stimulation to a localized area, it also provides precise millisecond control.  In earlier research, Paoli et al (2018) found that mice will readily self stimulate by pressing a bar when the ontogenetic stimulation is experienced as rewarding.

Optogenetic stimulation requires that the relevant neurons are infected with a virus that inserts a gene into the neuron’s genome that encodes a light-sensitive protein (a type of rhodopsin, similar to that which provides black and white vision in our eye).  The rhodopsin embeds into the neuron’s cell membrane where it can be stimulated by a tiny optic fiber implanted into ventral tegmental area.   When light is delivered through the optic fiber, the rhodopsin opens an ion channel that depolarizes the ventral segmental neurons causing neurotransmitter release into the nucleus accumbens.

As with cocaine self administration, mice found this ontogenetic stimulation highly rewarding and readily learned to self stimulate by pressing a bar.  After the mice were reliably self stimulating, a foot shock was paired with subsequent stimulations.  As with cocaine self administration, some mice continued self administration (were “persisters”) while others became “renouncers” and quit.

However, an unexpected outcome was that optogenetic self-administration was even more “addictive” than cocaine self-administration (50% vs 12-20% persisters)!  This difference turned out to be an important clue to understanding cocaine addiction liability in mice.

Why is optogenetic stimulation more addictive than cocaine stimulation?

An obvious difference is that cocaine went everywhere in the brain, while optogenetic stimulation was more confined to the reward pathway.  As mentioned earlier, dopamine, serotonin, and norepinephrine concentrations were elevated in many brain areas by cocaine.  Perhaps one of these 3 neurotransmitter was producing effects outside the reward circuitry that influenced cocaine addiction liability.  Based upon prior research, serotonin was a likely possibility.

To test whether serotonin was involved, Li et al looked at cocaine self administration in two mouse strains (referred to here as normal and SertKI) that were genetically identical except for the gene encoding their serotonin reuptake transporter.  In both strains, the serotonin transporter was effective at transporting extracellular serotonin back inside the neuron, however unlike the normal transporter, the SertKI transporter was not blocked by cocaine.  Both the normal and SertKI mice experienced dopamine elevations in the nucleus accumbens following cocaine self administration and both readily self administered cocaine.   However,  unlike normal mice, the SertKI mice did not also experience serotonin elevations.

After establishing cocaine self administration, the cocaine was again paired with footshock.  Li et al found that the SertKI mice were significantly more likely to become persisters than normal mice (56% vs 12%) with the percentage of SertKI persisters now resembling that of mice receiving optogenetic stimulation.  The footshocks were similarly painful for both strains and could not account for the difference.  Thus the elevated elevated extracellular serotonin caused by the cocaine appeared to suppress cocaine’s “addictiveness”.

However, one supportive experiment would not be sufficient to convince most scientists.   Accordingly, Li et al performed 3 additional experiments from 2 additional perspectives to examine the possible role of serotonin.  First of all, if optogenetic self stimulation is more addictive because it doesn’t elevate serotonin levels, then its addictiveness should be reduced by simultaneously elevating serotonin.  To do so, citalopram, a SSRI antidepressant, was used to elevate serotonin levels throughout the brain during optogenetic self stimulation.  Conversely, if cocaine is inhibiting its own addictiveness by elevating serotonin, then blocking the ability of the brain to respond to serotonin with either a serotonin receptor blocker (NAS181) or by using a strain lacking the relevant serotonin 2A receptor, should enhance cocaine’s addictiveness.  Without going into detail, Li et al obtained the predicted results in all 3 experiments.

Consequently multiple lines of evidence provide convincing support that serotonin inhibits mouse “addiction” to both cocaine and optogenetic stimulation.  The question then becomes, where in the brain does serotonin reduce addiction liability?

A neural pathway that influences addiction liability?

Fig 5. A schematic showing the neural pathway from the orbital frontal cortex to the dorsal striatum in red. This           pathway is inhibited by serotonin input (green) from neurons whose cell bodies are in the Raphe nuclei.  This inhibition reduces cocaine addiction liability in mice.  The dorsal striatum is enlarged in the next figure to show more detail.

In earlier research, Pascoli et al identified a neural pathway that influences optogenetic self-stimulation under conditions of punishment.   This pathway travels from the orbital frontal cortex (OFC) to the dorsal striatum (DS), and uses the neurotransmitter, glutamic acid  (See figure 5).  For brevity, this pathway will be referred to as the OFC/DS pathway.  This pathway becomes active during optogenetic reward and becomes progressively “strengthened” over time by a process called long-term potentiation.   (Long term potentiation is also thought to be a process by which conscious memories are permanently encoded in the cortex).

Long term potentiation results in both postsynaptic and presynaptic changes in glutamic acid synapses.  The postsynaptic neuron becomes more sensitive to glutamic acid by increasing a type of glutamic acid receptor called an AMPA receptor.  This increase makes it easier for glutamic acid to depolarize (i.e. activate) the postsynaptic neuron.  Following repeated use, the presynaptic neuron  also increases the amount of glutamic acid it releases each time it becomes active.  These two changes result in the glutamic acid synapses becoming progressively easier and easier to activate.  As the name “long term potentiation” implies, these changes are long lasting and can perhaps become permanent.

Very importantly, Pascoli et al also found that the activity in the OFC/DS pathway and the degree of strengthening was greater in the perseverers (i.e. addicted mice) than in the renouncers (i.e. unaddicted mice) providing evidence that this pathway plays a major role in extinguishing optogenetic self stimulation when  accompanied by foot shock.

Li et al  found that the OFC/DS pathway in mice self administering cocaine was similarly strengthened to a greater extent in perseverers than in renouncers.  The remaining important issue was how serotonin inhibits the OFC/DS pathway.

How serotonin Inhibits the OFC/DS Pathway.

Li et al were able to figure out, at the cellular level, how serotonin decreases the likelihood of mouse addiction.

Virtually all serotonin neurons in the brain have their cell bodies localized in the Raphe nuclei in the brainstem.  However, their axons project to many different areas in the brain and spinal cord.  The dorsal striatum (DS)  is one such area (See Figure 5).  Although serotonin can work through traditional axodendritic or axosomatic synapses, Li et al  found axoaxonic synapses to be most important for serotonin’s effect upon cocaine self administration in the DS.  As seen in Figure 6, serotonin secreted across an axoaxonic synapse hyperpolarizes (inhibits) the glutamic acid terminal in the DS by binding to a serotonin 2A receptor which decreases glutamic acid release by OFC terminals.  The inhibition of glutamic acid release also inhibits the development of long term potentiation which, in turn, decreases the likelihood of becoming a cocaine perseverer.

Fig 6. Inhibition of glutamic acid release in the dorsal striatum by a neuron from the orbital frontal cortex.  Repeated episodes of glutamic acid release caused by cocaine use strengthen this synapse by long-term potentiation.  Serotonin inhibits the strengthening of this synapse and decreases the likelihood of cocaine addiction in mice.

So why would the OFC and DS be involved in drug use and addiction? It is not surprising that the OFC would be involved in extinguishing addiction-related behaviors. The OFC is a part of prefrontal cortex, the executive center of the conscious brain.  The prefrontal cortex makes conscious decisions about what you should be doing and when you should be doing it.  Improper functioning of the prefrontal cortex often gives rise to poor decision making and poor impulse control, traits certainly seen in many drug addicts.  (Google “Phineas Gage” for a fascinating example of how a damaged prefrontal cortex affects behavior ).

The DS consists mainly of two structures called the caudate nucleus and putamen, which are part of a more extended system called the basal ganglia.  The basal ganglia are essential for helping motor cortex plan and execute motor movements and may also contribute to the motivation to perform these motor movements.  Consequently, I would speculate that the parts of the DS activated by the OFC/DS pathway are providing guidance to motor cortex relevant to the execution of, and motivation for, addiction-related behaviors.

(As an aside, Parkinson’s disease is caused by a selective loss of dopamine input into the DS.  As dopamine levels drop, the DS becomes progressively less able to provide necessary “advice” to motor cortex.  As a result, the Parkinsonian patient progressively loses the ability both to initiate and terminate motor movements.)

Concluding remarks and implications for treatment.

First of all, some caveats.  One should always be careful in generalizing mouse results to humans.   While animal models of human processes are often relevant for understanding human processes, they should always be viewed with caution until verified by research with humans.

Even if relevant to humans, one should also be careful about generalizing the neurology of cocaine addiction to addiction to other drugs.  At the same time, the plausibility is enhanced by the fact that two very different “addictive” procedures  (cocaine self administration and optogenetic self stimulation) are both influenced by the same OFC/DS pathway in mice!  Still, more research is necessary here as well.

I also left out details of much of the neuroanatomical research by both Pascoli et al and Li et al, that require a technical understanding beyond the scope of most readers (and to some extent, the writer of this post 😁).  I do encourage those interested in a deeper understanding to read these 2 papers.  While parts may be difficult to understand, these publications are excellent examples of the scientific method.  Miyazaki and Miyazaki (2021) provide an easier-to-understand overview of the Li et al paper.

One question I have, is what sort of information does the prefrontal cortex, the executive part of the human brain, use in activating the OFC/DS pathway?  The prefrontal cortex often integrates across a variety of inputs before arriving at decisions about what you should do.  Obviously the reward pathway influences the prefrontal cortex’s decision to engage in drug use.  In addition, input from the various senses,  relevant cortical memories of past experiences, as well as unconscious parts of the forebrain including the hippocampus, amygdala, and basal ganglia are possibly involved as well.  As I speculated earlier, perhaps even primitive parts of the unconscious brainstem contribute to the cortex’s decision to engage in drug-related behaviors.

Current addiction treatments are notoriously unsuccessful.  Around 85% of addicts receiving treatment relapse within a year according to the National Institute of Drug Abuse.  An important practical question raised by Li et al is whether cocaine addiction can be treated by methods that elevate brain serotonin. Perhaps the selective serotonin reuptake inhibitors (SSRI’s) used to treat depression might have efficacy.  And would this treatment also work for other addictive drugs?  If so, what would be the protocol for administering them?  And would these findings be relevant only for preventing addiction, or also for reversing addition after it has been established?  While both possibilities would be clinically significant, the latter is profoundly more important!  Perhaps other methods of manipulating the OFC/DS pathway would have clinical relevance as well.  Obviously these are all questions that require much future research.

So how might the Li et al paper be relevant to the question posed in this post’s title?  Their findings suggest that overactivity of the OFC/DS pathway during drug use may be a predisposition to addiction.  However this overactivity could arise from different neurological processes in different individuals.  Perhaps in some individuals, lower levels of serotonin are available to inhibit this pathway.  In other individuals, perhaps the problem is caused by a higher baseline of glutamic acid release.  Alternatively, perhaps receptor sensitivity differences to serotonin or glutamic acid are the “culprits”.  Or perhaps the problem might even be further “upstream” in the prefrontal cortex.  One can envision other problematic causes as well.  However, regardless of the “cause”, treating OFC/DS dysfunction might have efficacy in helping individuals better control their drug use.

Regardless,  Li et al’s results provide potential new directions for better understanding human drug addiction and hopefully will provide new insights into treatment as well.

References.

Li, Y., Simmler, L. D., Van Zessen, R., Flakowski, J., Wan, J. X., Deng, F., . . . Luscher, C. (2021). Synaptic mechanism underlying serotonin modulation of transition to cocaine addiction. Science (New York, N.Y.), 373(6560), 1252-1256. doi:10.1126/science.abi9086 [doi]

Miyazaki, K., & Miyazaki KW. (2021). Increased serotonin prevents compulsion in addiction. Science (New York, N.Y.), 373(6560), 1197-1198. doi:10.1126/science.abl6285 [doi]

Pascoli, V., Hiver, A., Van Zessen, R., Loureiro, M., Achargui, R., Harada, M., . . . Luscher, C. (2018). Stochastic synaptic plasticity underlying compulsion in a model of addiction. Nature, 564(7736), 366-371. doi:10.1038/s41586-018-0789-4 [doi]

https://wordpress.lehigh.edu/jgn2